

Source: https://www.waybeyond.io/resources/unlocking-grower-success-through-data-analysis?hsLang=en
27.04.2023 | 3 min readUnlocking grower success through data analysis


 When we ask growers how we can help them, they say “We want to reduce pests, diseases, and wastage. To use less water, less energy and less pesticides. In short: we want to be able to do our jobs better.”
Of course, these are a complex set of requests with no single ‘silver bullet’ solution but one of the ways to help these growers do their jobs better is by helping them collect and harness data and train them to interpret it so they have a greater level of confidence in the decisions they make every day.
In this blog post we’ll discuss 3 common issues that can be addressed by collecting and analysing data.
When we ask growers how we can help them, they say “We want to reduce pests, diseases, and wastage. To use less water, less energy and less pesticides. In short: we want to be able to do our jobs better.”
Of course, these are a complex set of requests with no single ‘silver bullet’ solution but one of the ways to help these growers do their jobs better is by helping them collect and harness data and train them to interpret it so they have a greater level of confidence in the decisions they make every day.
In this blog post we’ll discuss 3 common issues that can be addressed by collecting and analysing data.
- Crop loss due to disease.
- Variation in production output across sites
- Declining crop yield and quality
1. Crop loss due to disease
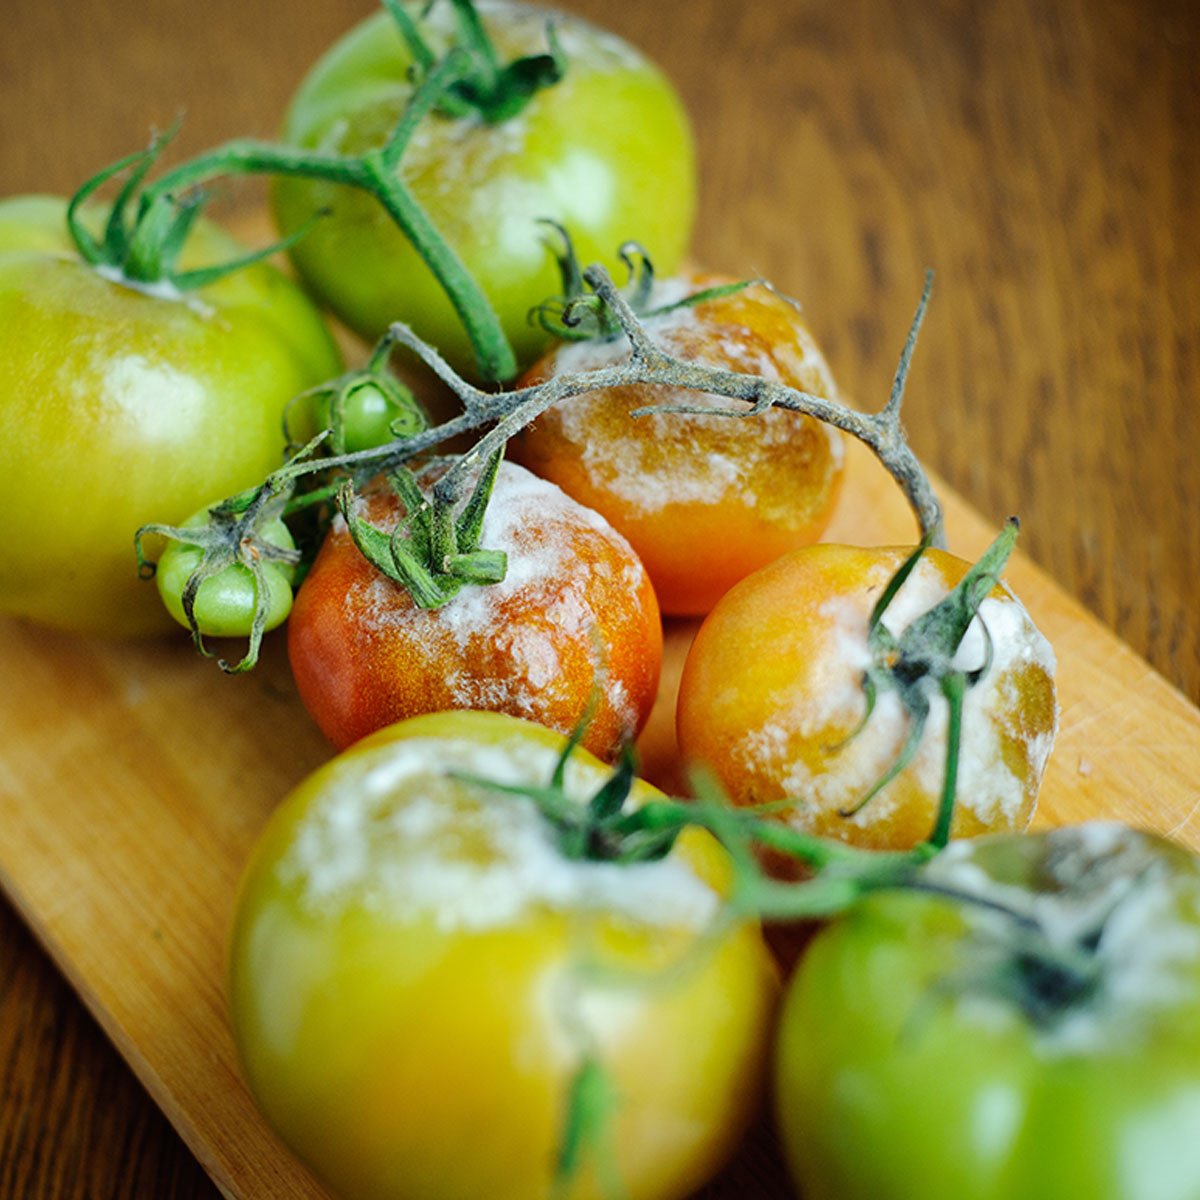
According to Rabobank, Botrytis (or grey mold) causes an estimated USD 10 Billion of economic loss per year, worldwide. Botrytis is a very common disease. It is a fungus that once established, can multiply rapidly because it produces a large volume of spores. To infect plants disease spores first need to germinate. This requires a source of moisture (dew, high humidity) combined with moderate temperatures. The disease requires this high humidity for an extended period of time (between 3-8 hours) and an ideal temperature range of 13-23C. Once these climate conditions are met, the disease thrives and becomes visible on plants about 2 weeks later.Disease profile of Botrytis
- Conditions for an outbreak are simple
- Multiplies rapidly
- Is hard to eradicate
- Prospers in conditions 13-23C (55-73F) in conditions greater than 90% humidity
40% crop loss is the final straw for one grower
One grower who approached WayBeyond was losing an increasing percentage of their crop each year due to Botrytis. The turning point came when that percentage finally hit a shocking 40% – for a 1 hectare greenhouse that represents over USD 150k in loss. The grower now wanted to solve the problem urgently, but without continuous data, it was hard to understand when the problem was happening and what action to take. To investigate the issue our portable wireless sensors were deployed and after a period of time, the data was studied. Here’s what was discovered.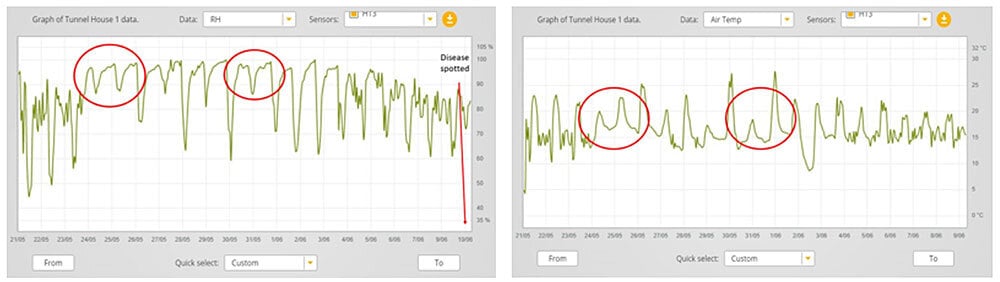 Click for larger image.
These are the graphs from the sensors. On the left is Relative Humidity and on the right is Air Temperature. The graphs show that two weeks before the disease was spotted by scouts, the humidity was exceptionally high, hitting the dew point several times for a sustained period while the temperature during that same timeframe was in that 13-23C zone.
By viewing this data and using information on Botrytis epidemiology, the grower was able to see what was contributing to their problem. This data provided the intelligence for the grower to make changes to their environment and future crop practices.
Additionally, as a fail-safe, alarms were set to trigger should climate conditions become perfect for the disease to flourish again, so growers would get fair warning to take remedial action.
Being able to track disease over time is important as it enables you to study correlations between disease prevalence and climatic conditions.
Click for larger image.
These are the graphs from the sensors. On the left is Relative Humidity and on the right is Air Temperature. The graphs show that two weeks before the disease was spotted by scouts, the humidity was exceptionally high, hitting the dew point several times for a sustained period while the temperature during that same timeframe was in that 13-23C zone.
By viewing this data and using information on Botrytis epidemiology, the grower was able to see what was contributing to their problem. This data provided the intelligence for the grower to make changes to their environment and future crop practices.
Additionally, as a fail-safe, alarms were set to trigger should climate conditions become perfect for the disease to flourish again, so growers would get fair warning to take remedial action.
Being able to track disease over time is important as it enables you to study correlations between disease prevalence and climatic conditions.
Other useful indicators to combat crop disease
Plants may also be more susceptible to disease if they are weak, wounded or stressed, so collecting additional data provides more context and helps build a picture of disease risk. An important reading to capture is Vapour Pressure Deficit (VPD). VPD is the difference between the pressure exerted by water vapour held in saturated air and the pressure exerted by the water vapour that is held in the air being measured at the same given temperature. This difference is what drives transpiration from the plants’ stomata and so provides an indicator of current plant stress levels. Low VPD for example means low transpiration and would cause plant metabolism to slow down, inhibiting development and increasing susceptibility to disease. In this graph you can see exactly this. Here we observe periods of high humidity and low VPD which in a short period become ideal conditions for an outbreak of Botrytis to occur.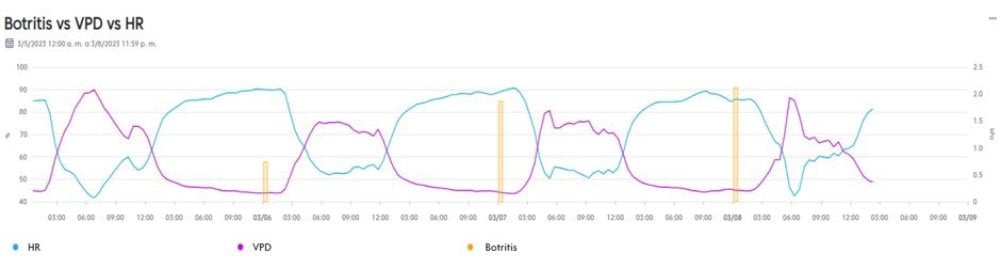 VPD can be captured with a plant temperature sensor placed directly on the stem or leaf. Many systems offer an estimation of VPD but a plant temperature sensor provides actual VPD.
When it comes to disease it’s best to consult a plant pathologist. They need to understand your situation to provide recommendations and the more data you can provide to them, the better they can do their job to help you.
VPD can be captured with a plant temperature sensor placed directly on the stem or leaf. Many systems offer an estimation of VPD but a plant temperature sensor provides actual VPD.
When it comes to disease it’s best to consult a plant pathologist. They need to understand your situation to provide recommendations and the more data you can provide to them, the better they can do their job to help you.
2. Variation in output across sites
Our next example involves a grower who received complaints from a supermarket they supplied about their product’s shelf life. The supermarket expressed serious concerns as shelf-life was very poor. But only a percentage of the product supplied had a short shelf-life while the rest were fine. When this was investigated, the grower found the poor shelf-life product originated from one greenhouse while the rest were grown in another. So what was happening in that greenhouse? They needed the answer to salvage their relationship with the supermarket.First steps to revealing the issues
Their first step was to install our portable wireless sensors in both greenhouses to capture air temperature, radiation, humidity, and carbon dioxide. The installation meant they could compare conditions in each greenhouse, to benchmark one against the other. If they could replicate conditions from the high performing greenhouse in the poor performing one, the product shelf life could be improved. Studying the data revealed stark differences between the climate conditions in these two greenhouses. Greenhouse 1 was the poor performer. Compared to Greenhouse 2 it had lower night temperatures and higher humidity. Additionally, there was a difference in radiation and CO2. You can see in Greenhouse 1, there was a larger variation in the CO2 compared to Greenhouse 2.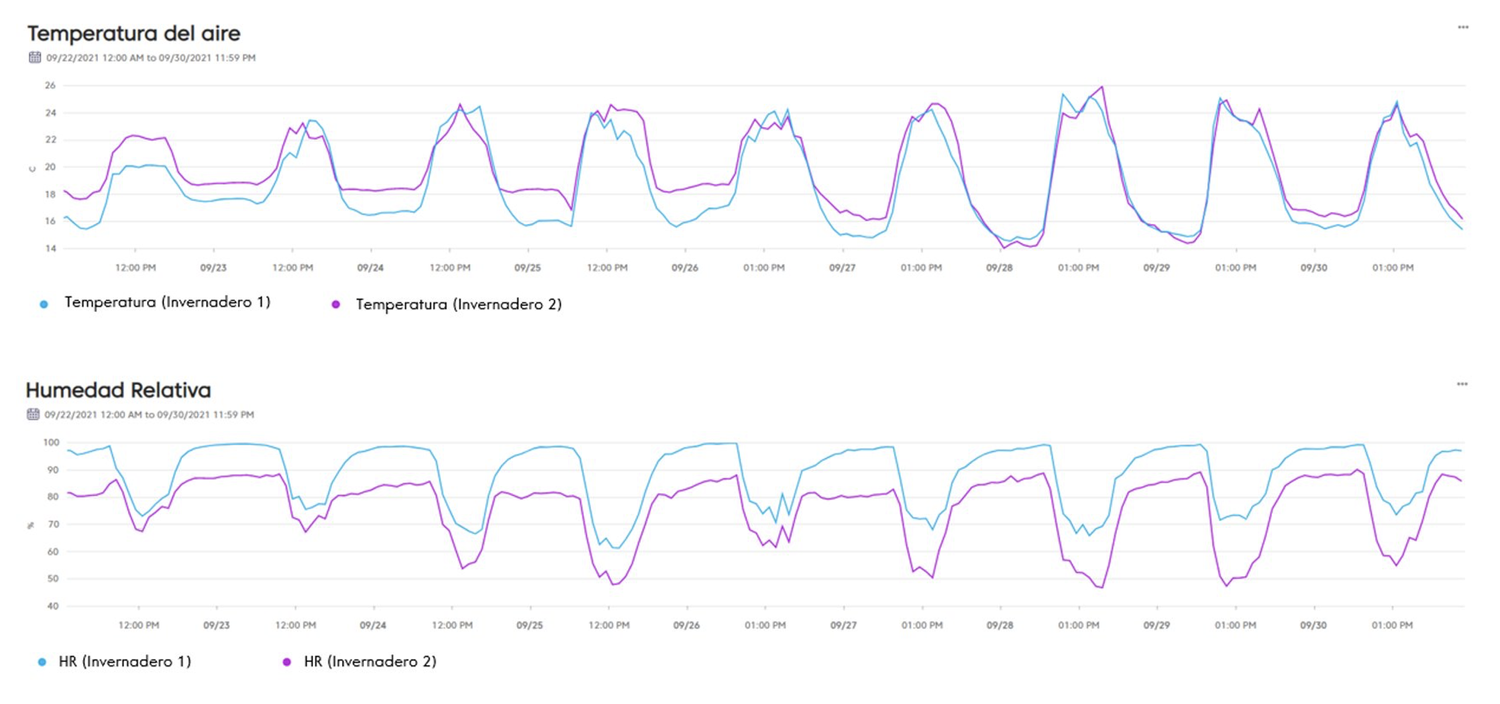
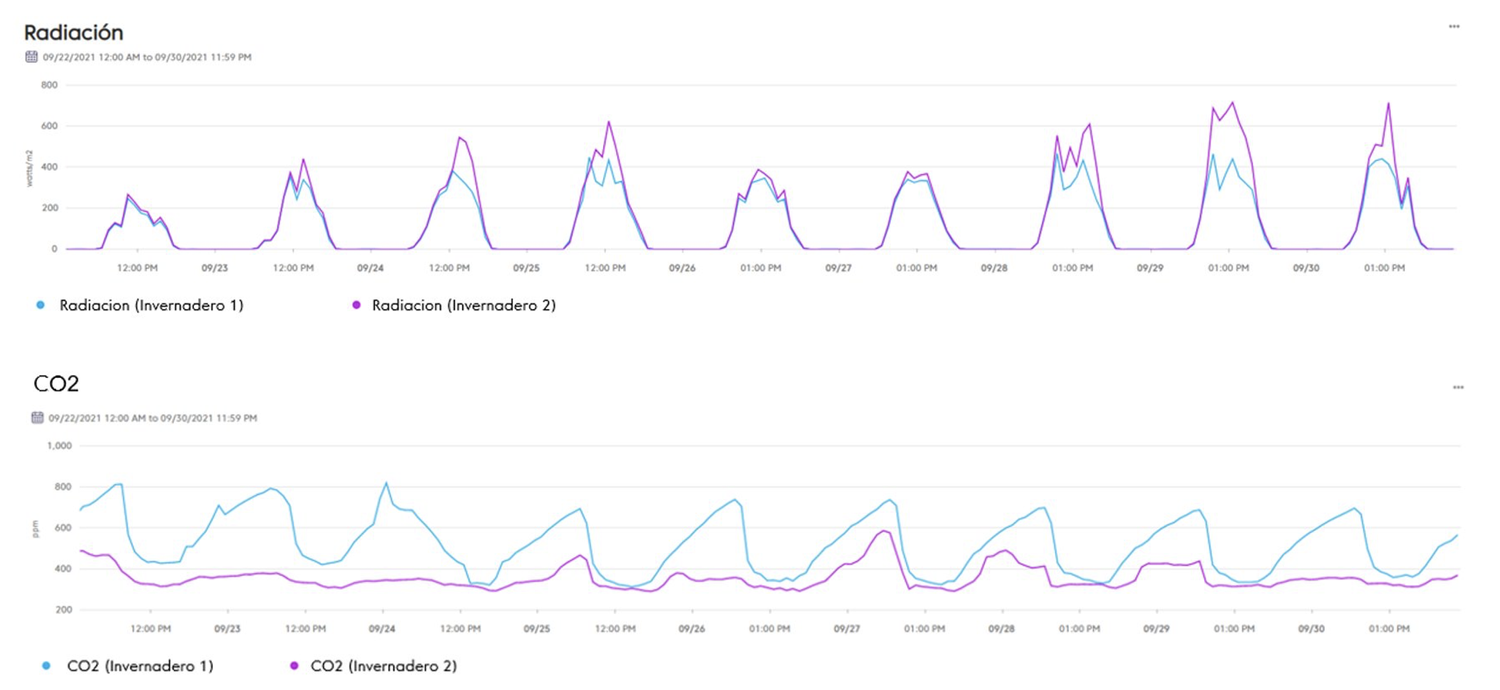
Why was Greenhouse 2 performing better?
Greenhouse 2 had higher night temperatures which meant higher 24hr average temperatures. Generally higher average temperatures are better for growing. Greenhouse 2 had higher radiation which produced stronger, sturdier plants. Greenhouse 2 also had lower humidity so therefore lower disease risk. Lastly Greenhouse 2 had smaller CO2 variation. This last point, the grower discovered, was because Greenhouse 2 had a ventilation fan which enabled better air flow to the plant and better CO2 oxygen flow within the plant. So by uncovering these factors and with the data to provide solid intelligence, they could confidently invest in improving the infrastructure of Greenhouse 1 to bring it into line with Greenhouse 2 and increase their shelf life. Variance in production is something that growers want to avoid but often one facility produces more than another. While they may have a hunch on the reasons for this, they can only put forward their best guesses. Without tangible data to draw conclusions, it is very hard to propose changes or make investments that might improve the output of the lagging facility.3. Declining crop yield and quality
The last example is from a farm that was experiencing lower crop yield and quality. The grower noticed this reduction but the causes weren’t clear. When it comes to their plants, grower get a lot of satisfaction from successfully trouble-shooting issues – so it bothered him that he couldn’t find an explanation. While he had his suspicions – he thought perhaps it was something happening during the crop cycle – he wanted to know the real reasons. But at that time only handheld readings were taken – there just wasn’t enough data to be useful in finding an answer. Our portable wireless sensors were deployed in the area of the tunnel house where the problem was occurring and real-time climate and environmental data began trickling in. He also used our mobile app to regularly collect data on crop growth, digitally.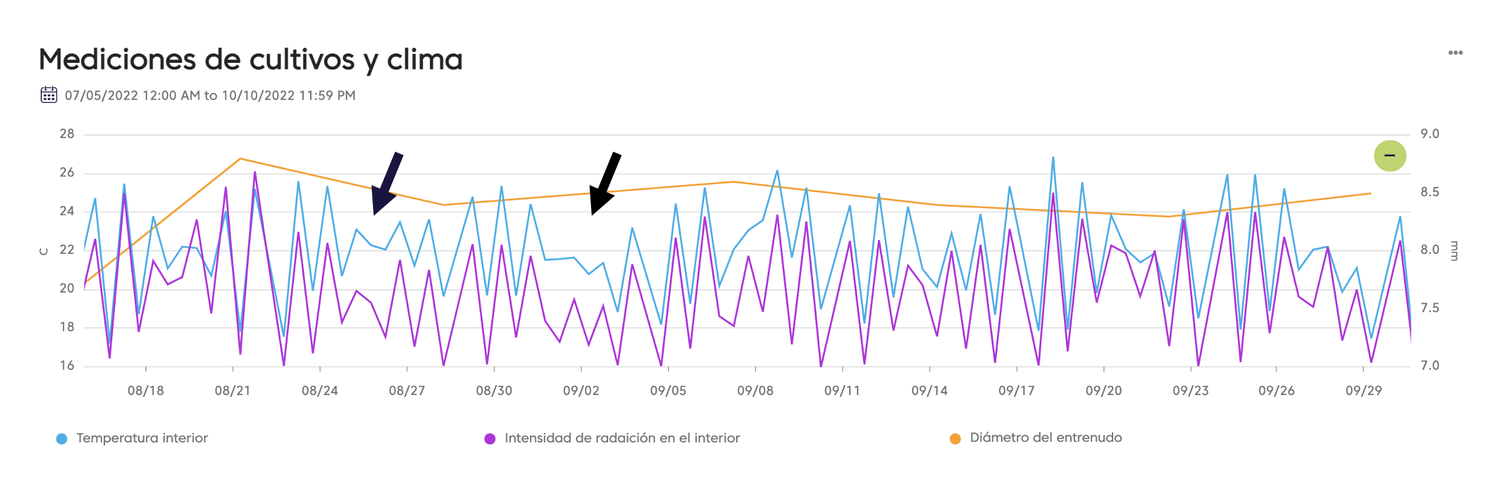 As the data accumulated, the grower noticed periods of poor plant growth which may have contributed to the reduced crop yield and quality. Digging deeper, the data revealed climate influences for that period. He could see that poor plant growth (indicated by lower stem diameter) may have been due to assimilate limitations (for example, sugars produced by photosynthesis) when he looked at the light and temperature curves.
Today, the value of data for this grower is in the ongoing awareness of plant health and the ability to take action with a higher level of certainty than just best guesses. He acknowledged that if the right kind of data had been collected sooner, this issue could have been managed by adjusting the climate to maintain active growth and avoiding stressing the plants.
Now he has experienced this crop health visibility from data and the advantages it provides, he is a convert to digital agronomy and will continue to collect and analyse data to help him grow better crops.
Solving these kind of problems by collecting data doesn’t have to mean huge investment, disruption or months of tech training. Small steps can be made today with simple digital tools so you get a clearer picture of your environment, climate, crop health and events that might threaten it.
If you are not collecting data, begin as soon as you can. If you are already collecting data, ask yourself “Is it comprehensive enough?” i.e. would the data you currently collect help you investigate and resolve the 3 issues above?
Ideally your data should be:
As the data accumulated, the grower noticed periods of poor plant growth which may have contributed to the reduced crop yield and quality. Digging deeper, the data revealed climate influences for that period. He could see that poor plant growth (indicated by lower stem diameter) may have been due to assimilate limitations (for example, sugars produced by photosynthesis) when he looked at the light and temperature curves.
Today, the value of data for this grower is in the ongoing awareness of plant health and the ability to take action with a higher level of certainty than just best guesses. He acknowledged that if the right kind of data had been collected sooner, this issue could have been managed by adjusting the climate to maintain active growth and avoiding stressing the plants.
Now he has experienced this crop health visibility from data and the advantages it provides, he is a convert to digital agronomy and will continue to collect and analyse data to help him grow better crops.
Solving these kind of problems by collecting data doesn’t have to mean huge investment, disruption or months of tech training. Small steps can be made today with simple digital tools so you get a clearer picture of your environment, climate, crop health and events that might threaten it.
If you are not collecting data, begin as soon as you can. If you are already collecting data, ask yourself “Is it comprehensive enough?” i.e. would the data you currently collect help you investigate and resolve the 3 issues above?
Ideally your data should be:
- continuously captured
- Visible as graphs and charts
- contains as many data points as possible
- accessible from anywhere to the individuals that require visibility
Steps towards data driven decision making
Collecting and analyzing data is a powerful tool in addressing common problems in controlled environment agriculture. By harnessing data to understand the correlation between disease prevalence and climatic conditions, growers can take appropriate action to mitigate disease outbreaks. In addition, data helps growers identify the causes of variations in output across sites and take corrective measures to improve crop quality and yield. Finally, data can be used to optimize resource use, leading to reduced water and energy usage, and reduced dependence on pesticides. Overall, data-driven decision-making can help growers do their job better by improving productivity, quality, and sustainability.
Featured Resources

- ARTICLE
- CROP MANAGEMENT
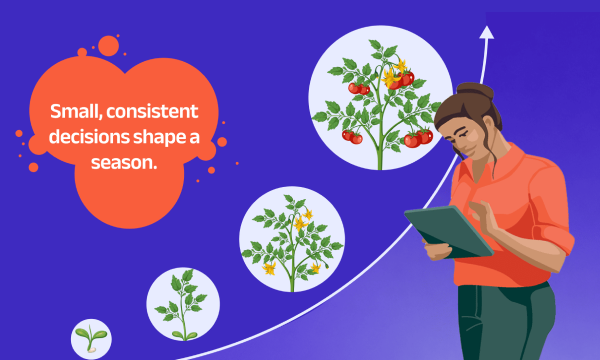
The Compounding Effect of Daily Crop Management Decisions
Strong crop outcomes rarely come from one big decision. More often, they’re built through small,… START READING
- INDUSTRY
- CROP MANAGEMENT
- ARTICLE
Five Ways to Make Your Fertilizer Go Further On the Farm
Surging fertilizer prices and supply shortages are forcing growers to rethink how they use… START READING
- DARRYN KEILLER
- PODCAST
- INDUSTRY
Podcast: How Data is Changing the Way We Grow
Darryn Keiller joins the Computomics Podcast to explore how digital agronomy is powering real-world… LISTEN NOW
- ARTICLE
- CROP MANAGEMENT
Preventing Powdery Mildew Disease in Your Crops
From early signs to prevention, here’s how to manage powdery mildew fungal disease in crops. START READING
- ARTICLE
- CLIMATE
- CROP MANAGEMENT
Preventing Frost Damage in Plants: What Growers Need to Know
Learn how to prevent frost damage in your crops with expert grower tips, from early risk monitoring… START READING
- ARTICLE
- CROP MANAGEMENT
Understanding Botrytis and How Growers Can Prevent It
Keep your crops safe from Botrytis (gray mold) disease using early detection and simple… START READING.png)
- ARTICLE
- CROP MANAGEMENT
- CLIMATE
Managing Crop Risks Through Grower Alerts
Discover how growers use predictive alerts to manage crop risks from frost, diseases, and extreme… START READING
- ARTICLE
- CROP MANAGEMENT
- CLIMATE
What Is the Best Weather for Crop Spraying?
Spraying your crops in poor weather conditions can waste chemicals, increase costs, and harm… START READING
- ARTICLE
- CROP MANAGEMENT
How Climate Insight Levels the Protected Cropping Field
Daniel Than, Customer Success Director at WayBeyond, explains why actionable climate insight—not… START READING
- CROP MANAGEMENT
- ARTICLE
- CLIMATE
Weather risk management for crops
Learn how to manage weather-related risks for your crops using an early warning system such as… START READING
- ARTICLE
- CROP MANAGEMENT
AI Meets Agronomy: GrowPilot Helps Growers Act Before the Weather Does
WayBeyond’s new GrowPilot app brings artificial intelligence into the hands of small to… START READING
- NEWSLETTER
- INDUSTRY
- CROP MANAGEMENT
GoWayBeyond Vol.4 | Small Shifts, Big Impact
From cutting water use in drought-hit regions like Morocco to preventing thousands in losses from… START READING
- CASE STUDY
- CUSTOMER CHAMPIONS
- TOMATO
- CROP MANAGEMENT
Eliven Tropical: Using FarmRoad to Detect Early Stress and Prevent Crop Loss
When faced with crop losses due to climate events and system failures, Eliven Tropical turned to… START READING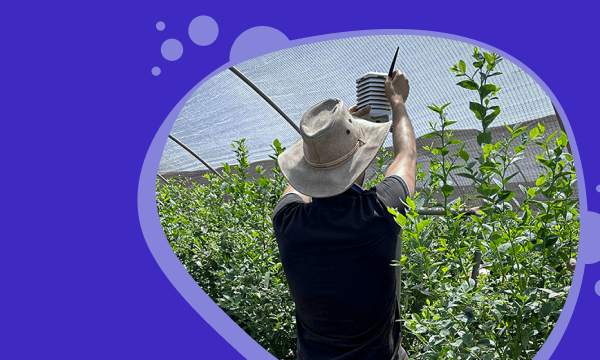
- IRRIGATION
- CROP MANAGEMENT
- BLUEBERRY
- ARTICLE
Optimized: Berry Irrigation in Morocco
A leading Moroccan berry grower cut water use by 16% using climate data and ETo-based irrigation… START READING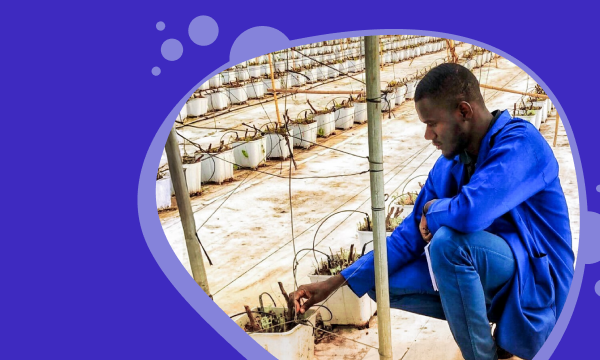
- IRRIGATION
- ARTICLE
- CROP MANAGEMENT
Optimized: An Irrigation Guide
ETo forecasting is a simple but powerful tool for optimizing irrigation every day, in every season… START READING.png)
- NEWSLETTER
- INDUSTRY
Go WayBeyond Vol. 3 | Actionable Insights, Better Decisions
From breeding climate-resilient berry varieties in Australia to testing precision irrigation… START READING
- ARTICLE
- IRRIGATION
- CROP MANAGEMENT
- TOMATO
Optimized: Irrigation
See the strategy behind evapotranspiration-based irrigation planning that helped a greenhouse… START READING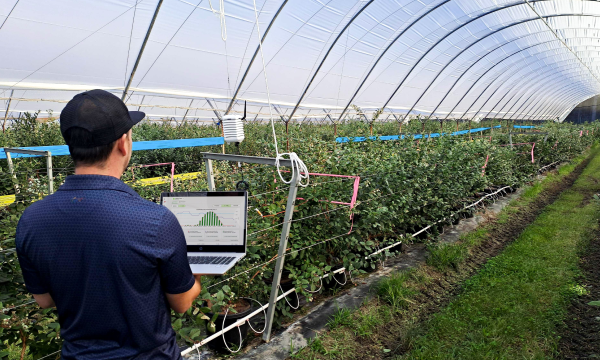
- ARTICLE
- BLUEBERRY
From Breeding to Breakthrough: How Costa Group Is Using FarmRoad to Grow Better Berries
Costa Group is using WayBeyond’s FarmRoad platform to support its elite blueberry breeding program… START READING
- DARRYN KEILLER
- ARTICLE
- INDUSTRY
Soil Under Pressure: Why Data-Driven Decisions Are the Foundation of Resilient Growing
Soil systems around the world are under pressure. Pollution, climate extremes and unsustainable… START READING
- DARRYN KEILLER
- INDUSTRY
- ARTICLE
AgTech’s Golden Hour: Why the Future of Food Needs Smarter Capital and Even Smarter Data
AgTech enters 2025 with strategic investments prioritizing long-term food security over quick… START READING
- NEWSLETTER
- INDUSTRY
Go WayBeyond Vol. 2 | Growing Smarter, Thinking Bigger
Our newsletter explores the evolving world of agriculture through the lens of innovation, insight,… START READING
- PODCAST
- DARRYN KEILLER
The Future of Farming: AI, Digital Agronomy, and the Water Crisis
Darryn shares how digital agronomy and AI-powered solutions help farmers optimize production,… LISTEN NOW
- ARTICLE
- CROP MANAGEMENT
The transition to digital agronomy: it all starts with effective change management
Learn how a people-first approach to change management empowers growers to successfully transition… START READING
- CROP MANAGEMENT
- ARTICLE
Practical guide for growers: leveraging data for effective crop management
The grower’s guide to using data for effective crop management. Get practical tips to achieve… START READING
- ARTICLE
- DARRYN KEILLER
- INDUSTRY
Feeding the Future: global innovations for a resilient food system
Darryn Keiller shares his thoughts on the urgent need to rethink farming, tackle regional… START READING
- CASE STUDY
- CUSTOMER CHAMPIONS
HM.CLAUSE Kenya and WayBeyond: A Partnership for Optimized Seed Production
The HM.CLAUSE Kenya seed production team faced several challenges in optimizing their yield… START READING
- CASE STUDY
- TOMATO
- CROP MANAGEMENT
- CUSTOMER CHAMPIONS
Agrícola Chaparral uses data to prevent tomato crop loss
With late blight causing crop loss and large costs, Agrícola Chaparral turned to digital agronomy… START READING
- IRRIGATION
- CROP MANAGEMENT
- CLIMATE
Six essential weather data points for irrigation management
Learn how six key weather data points can help you make smarter irrigation decisions, conserve… START READING
- ARTICLE
WayBeyond on the road with Daniel Than
Two weeks, three countries, and ten customer farm visits later, Daniel Than, WayBeyond’s Customer… START READING
- CROP MANAGEMENT
- IRRIGATION
Five reasons why commercial growers need irrigation management software
A smart approach to water management is key to helping growers tackle water scarcity and climate… START READING
- CASE STUDY
- BLUEBERRY
- CROP MANAGEMENT
- CUSTOMER CHAMPIONS
African Blue: real-time climate and plant health visibility improves crop management
With over 470 ha of blueberry production, African Blue needed to unify farm data to improve crop… START READING
- ARTICLE
- DARRYN KEILLER
- INDUSTRY
- TOMATO
Some Thoughts on Tomato Seeds
What if tomato seeds were treated as commodities? This article explains how data and AI can help… START READING
- ARTICLE
- IRRIGATION
- CROP MANAGEMENT
The grower’s guide to drip and drain monitoring
Uncover the vital role of drip and drain monitoring in optimizing drip irrigation farming. START READING
- ARTICLE
- IRRIGATION
- CROP MANAGEMENT
An introduction to smart irrigation using data insights
Explore how protected cropping growers can use data insights to drive smart irrigation practices. START READING.png)
- CUSTOMER CHAMPIONS
- IRRIGATION
Meet Khawla, R&D Manager at African Blue
Learn how Khawla Derstaouieh embraces digital agronomy to optimize irrigation, track pests, and… START READING
- DARRYN KEILLER
- ARTICLE
- IRRIGATION
- INDUSTRY
Here’s How Climate Change Affects What You Eat
Heatflation is rising food prices caused by extreme heat from climate change. How can protected… START READING
- ARTICLE
- CROP MANAGEMENT
- BLUEBERRY
Avoiding plant heat stress in berry crops
Heat stress is a significant concern for berry growers as it has both positive & negative effects… START READING
- TOMATO
- WHITEPAPER
- YIELD PREDICTION
Beyond Yield Prediction: the importance of climate and context
Do growers focus too much on high accuracy yield forecasting and miss key contextual indicators? START READING
- CUSTOMER CHAMPIONS
Meet Sanaa, Phytosanitary Manager at African Blue
Discover how Sanaa Elmarini enhances decision-making in blueberry crop management at African Blue… START READING
- PRESENTATION
- DARRYN KEILLER
- INDUSTRY
Fruit Logistica 2024: Rethinking Horticulture
Practical solutions for today’s challenges in the world of horticulture. From real-time data to… START WATCHING
- ARTICLE
- CROP MANAGEMENT
Cultivating better crop outcomes with real-time alerts
Real-time alerts play a vital role in empowering growers to make better crop management decisions. START READING
- PODCAST
- DARRYN KEILLER
Tiny Little Victories: Sustainable farming and saving the planet
Darryn addresses the importance of food security, how the pandemic showed a real vulnerability in… LISTEN NOW
- PRESENTATION
- CROP MANAGEMENT
Fruit Logistica 2024: 3 common grower problems solved with digital agronomy
Real world examples of common issues faced by growers that can be solved with real-time data,… START WATCHING
- TOMATO
- ARTICLE
- CROP STEERING
Crop steering 101: how to optimize tomato growth for maximum yield
In this crop steering guide, you’ll learn how to adjust environmental factors for ideal plant… START READING
- ARTICLE
- WAYBEYOND LIFE
Fruit Logistica 2024 round up
Fruit Logistica 2024 in Berlin wrapped last week, bringing to a close its biggest edition yet with… START READING
- TOMATO
- ARTICLE
- CROP STEERING
The important role of plant balance in tomato crop steering
Discover strategies for maximizing crop yields by balancing generative/vegetative growth. START READING
- WEBINAR
- CROP MANAGEMENT
4 common grower problems solved with digital agronomy
The protected crop growers guide to successfully managing your plants, team, practices and… START WATCHING
- PODCAST
- DARRYN KEILLER
- INDUSTRY
This Climate Business: Farming indoors
The future of farming may be indoors. We know that’s already happening for tomatoes and leafy… LISTEN NOW
- ARTICLE
- WAYBEYOND LIFE
Morocco Berry Conference 2023 round up
Read our team’s report on the 2023 Morocco Berry Conference, held in Agadir. START READING
- TOMATO
- WEBINAR
- YIELD PREDICTION
The importance of climate and context data in tomato production
Learn how interpreting crop yield prediction with contextual data improves decision-making and… START WATCHING
- ARTICLE
- WAYBEYOND LIFE
Fruit Attraction 2023 round up
WayBeyond’s team share first impressions, general observations and key takeaways from Fruit… START READING
- WEBINAR
- CROP MANAGEMENT
Adopting crop management software
SaaS adoption in horticulture: discover challenges and pitfalls for both growers and technology… START WATCHING
- ARTICLE
- BLUEBERRY
- CROP MANAGEMENT
Mitigating Frost Risk in Blueberries
Frost devastates blueberry crops, leading to significant economic losses. By harnessing digital… START READING
- ARTICLE
- CROP MANAGEMENT
Unlocking grower success through data analysis
Digital agronomy insights helps tackle crop loss, production variations, and declining yield by… START READING
- PRESENTATION
- YIELD PREDICTION
Global Tomato Congress 2023: Beyond yield prediction
Lee Kirsopp challenges the need for high accuracy yield prediction. Can other data provide better… START READING
- ARTICLE
- WAYBEYOND LIFE
GreenTech Americas 2023 round up
Insights and reflections from the WayBeyond team at GreenTech Americas 2023, held in Querétaro,… START READING
- PRESENTATION
- CROP MANAGEMENT
GreenTech Americas 2023: Production problems solved by collecting the right data
3 production problems that can be solved by collecting data: cross loss from disease, poor crop… START WATCHING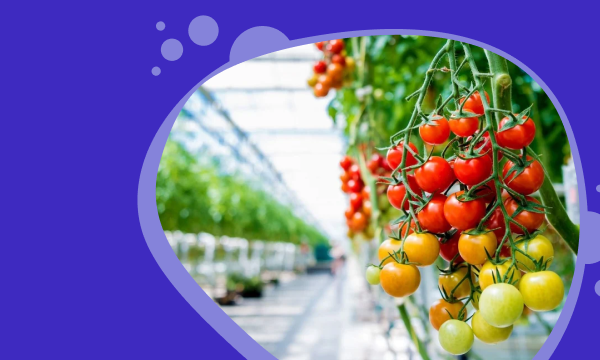
- TOMATO
- ARTICLE
- YIELD PREDICTION
Rethinking the singular focus on high accuracy in tomato yield prediction
WayBeyond’s study unveils factors behind yield swings and proposes an alternative to improve yield… START READING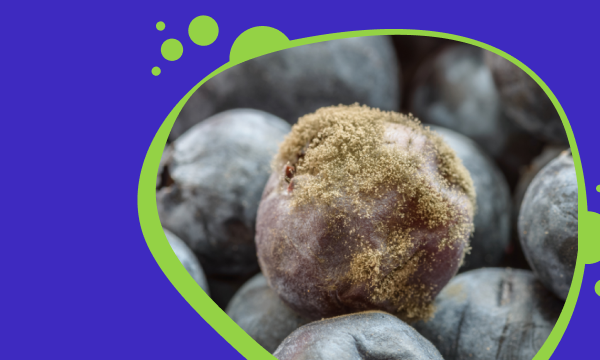
- WEBINAR
- CROP MANAGEMENT
Uncovering warning signs of fungal disease in your growing environment
Discover the true cost of a fungal disease outbreak in crops, how to respond and the financial… START WATCHING
- ARTICLE
- CROP MANAGEMENT
Forging a technology pathway into Mexico
With protected agriculture on the rise, Mexico is ripe for the next wave of tech innovation. START READING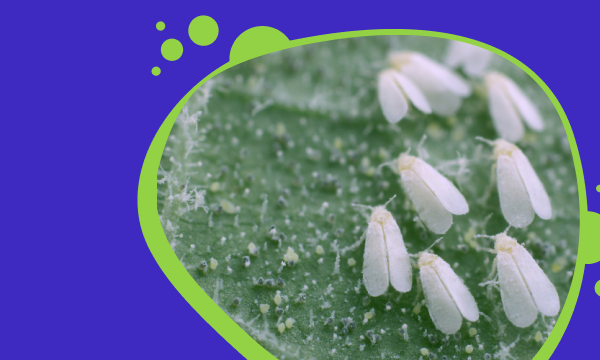
- WEBINAR
- CROP MANAGEMENT
Combating harmful crop pests without spraying more chemicals
Get insights on Integrated Pest Management planning for effectively managing infestations. START WATCHING
- ARTICLE
- YIELD PREDICTION
Applying AI to Controlled Environment Agriculture
Learn the challenges and potential of AI and machine learning in agriculture for sustainable crop… START READING
- ARTICLE
- WAYBEYOND LIFE
Fruit Logistica 2023 round up
Read the round up of Berlin Fruit Logistica 2023 from the WayBeyond team on the ground. START READING
- WEBINAR
- CROP MANAGEMENT
How to manage plant stress and improve crop performance
Learn how to manage plant stress and improve crop performance with Vapour Pressure Deficit. START WATCHING
- ARTICLE
- CROP MANAGEMENT
How implementing digital agronomy elevated African Blue’s blueberry production
Harnessing FarmRoad enabled to monitor the status of their crops and the farm as a whole and… START READING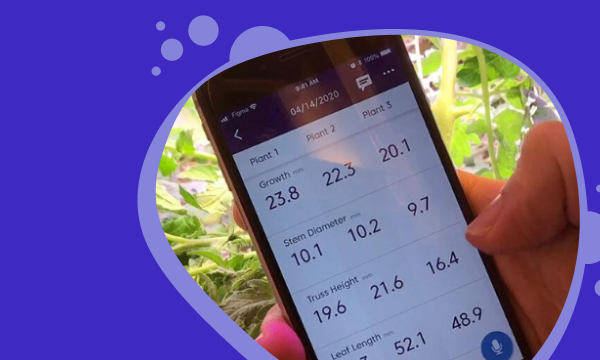
- ARTICLE
- CROP MANAGEMENT
- TOMATO
Why crop registration is a vital part of your crop management
Why do growers use crop registration and how does it benefit crop management practices? START READING
- PODCAST
- DARRYN KEILLER
Revolving door syndrome: Can we feed people without breaking the planet?
Our food systems face uncertainty in the wake of Climate Change. Cyclone Gabrielle highlighted the… LISTEN NOW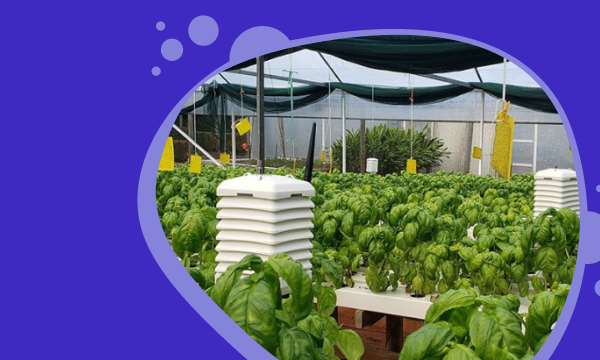
- ARTICLE
- CROP MANAGEMENT
Sensor network delivers improved crop status visibility
Growers require frequent and detailed climate data and crop status visibility to get the best from… START READING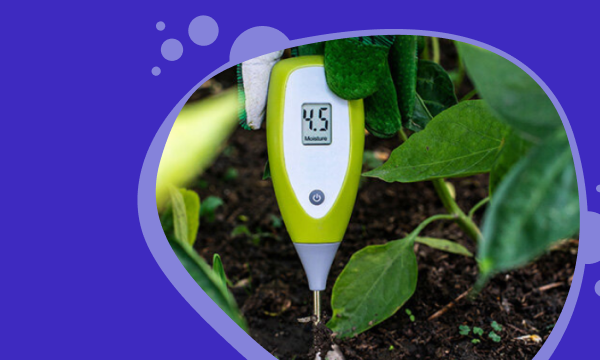
- ARTICLE
- CROP MANAGEMENT
The problem with handheld moisture meters for plants
While the popularity of hand held moisture meters for plants shows no signs of abating, there are… START READING
- CASE STUDY
- CROP MANAGEMENT
Season Farms manages plant heat stress to improve production
The agronomist at Season Farms noticed a drop in production and turned to WayBeyond’s digital… START READING
- CROP MANAGEMENT
- WEBINAR
Plant Disease and Sanitation
Plant pathology is the study of plant diseases and how they interact with plants. In this in-depth… START WATCHING
- ARTICLE
- WAYBEYOND LIFE