> ## Documentation Index
> Fetch the complete documentation index at: https://waybeyond.mintlify.site/llms.txt
> Use this file to discover all available pages before exploring further.
# How can I use FarmRoad's Irrigation Forecast Dashboard to help me plan my irrigation schedule?
## What is FarmRoad's Irrigation Forecast Dashboard?
FarmRoad's Irrigation Forecast Dashboard combines climate insights with sophisticated water demand (ET) models to make planning and forecasting irrigation easier than ever
The irrigation forecast dashboard is comprised of the following :
* An hourly outside climate forecast for up to 48 hours ahead
* A daily weather forecast for up to 7 days ahead
* A sophisticated Evapotranspiration water demand model for both the hourly and daily forecasts
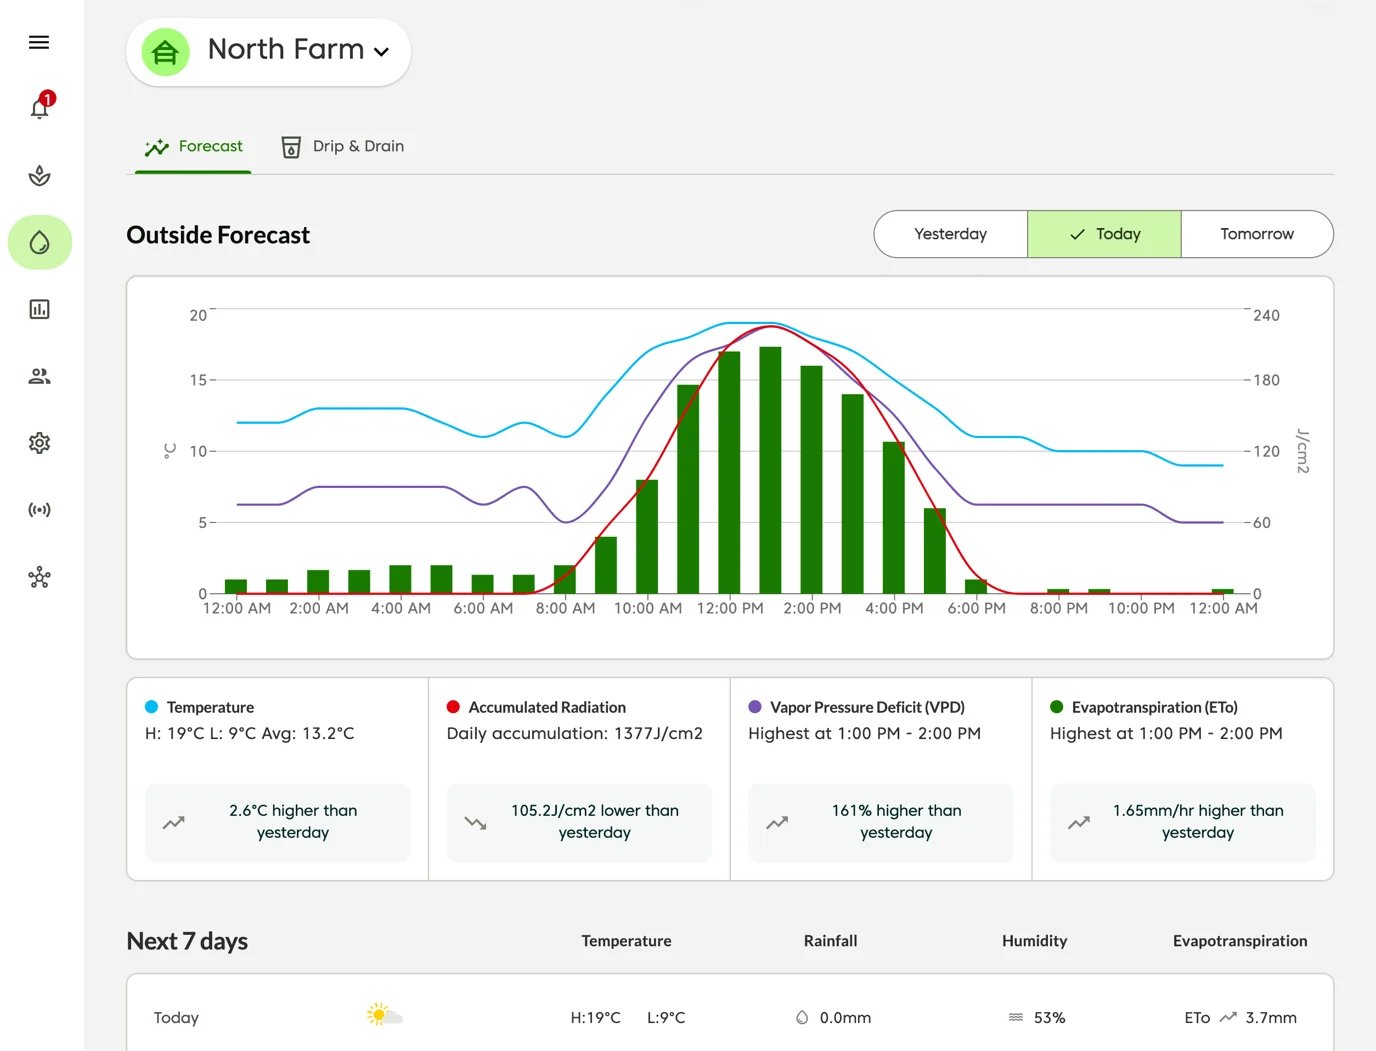 The hourly climate forecast includes the following data points:
1. **Temperature** (Celcius) - the outside/outdoor temperature
2. **Accumulated Radiation** (J/cm2) - the hourly accumulated radiation
3. **Vapour Pressure Deficit** (kPa) - the difference between the amount of moisture in the air and how much moisture the air can hold when it is saturated
4. **Evapotranspiration** (mm) - reference Evapotranspiration (ETo), which is an estimate for how much water will be lost due to a combination of evaporation and transpiration of a reference crop, given the predicted climate conditions
Moving the mouse cursor (web) or dragging a finger (mobile or tablet) over the graph will bring up a tooltip showing the values at the nearest hour.
By clicking on one of the above data types in the legend, you can simplify the graph if desired.
## How can I use the forecast dashboard?
The way you use the forecast dashboard will depend on your unique irrigation strategy, but we can provide some recommendations:
* Take note of the times of peak radiation, VPD, and evapotranspiration throughout the day. These are the times when you should carefully consider adjusting irrigation volumes.
* Compare yesterday’s peak times for radiation, VPD, and evapotranspiration with today’s. This can help you understand what changes you may need to make compared with yesterday’s irrigation schedule.
* Observe the evapotranspiration figures and trends for the next 7 days to understand how irrigation volumes may change over the coming week.
* Review the 7-day forecast for any unexpected or extreme weather conditions that you may need to prepare for in advance.
* For the previous day, compare the volumes you irrigated each hour with the hourly evapotranspiration curve for yesterday. You should see a close correlation. If you do not see a similar trend, it may be worth reviewing your irrigation strategy.
The hourly climate forecast includes the following data points:
1. **Temperature** (Celcius) - the outside/outdoor temperature
2. **Accumulated Radiation** (J/cm2) - the hourly accumulated radiation
3. **Vapour Pressure Deficit** (kPa) - the difference between the amount of moisture in the air and how much moisture the air can hold when it is saturated
4. **Evapotranspiration** (mm) - reference Evapotranspiration (ETo), which is an estimate for how much water will be lost due to a combination of evaporation and transpiration of a reference crop, given the predicted climate conditions
Moving the mouse cursor (web) or dragging a finger (mobile or tablet) over the graph will bring up a tooltip showing the values at the nearest hour.
By clicking on one of the above data types in the legend, you can simplify the graph if desired.
## How can I use the forecast dashboard?
The way you use the forecast dashboard will depend on your unique irrigation strategy, but we can provide some recommendations:
* Take note of the times of peak radiation, VPD, and evapotranspiration throughout the day. These are the times when you should carefully consider adjusting irrigation volumes.
* Compare yesterday’s peak times for radiation, VPD, and evapotranspiration with today’s. This can help you understand what changes you may need to make compared with yesterday’s irrigation schedule.
* Observe the evapotranspiration figures and trends for the next 7 days to understand how irrigation volumes may change over the coming week.
* Review the 7-day forecast for any unexpected or extreme weather conditions that you may need to prepare for in advance.
* For the previous day, compare the volumes you irrigated each hour with the hourly evapotranspiration curve for yesterday. You should see a close correlation. If you do not see a similar trend, it may be worth reviewing your irrigation strategy.