> ## Documentation Index
> Fetch the complete documentation index at: https://waybeyond.mintlify.site/llms.txt
> Use this file to discover all available pages before exploring further.
# How do I install my Substrate Moisture Sensor?
## Installation instructions
1. Fully insert the sensor into the substrate/soil, including the black plastic base. Make sure there are no air gaps between the sensor and the surrounding material as shown in Figures 1 and 2 below.
2. Pack the substrate/soil around the sensor to fully cover the black plastic base and a few centimetres of the wire.
3. Position the sensor with appropriate distance from the wall of the pot, the bottom of the pot, and the top surface of the substrate, as shown in Figure 1.
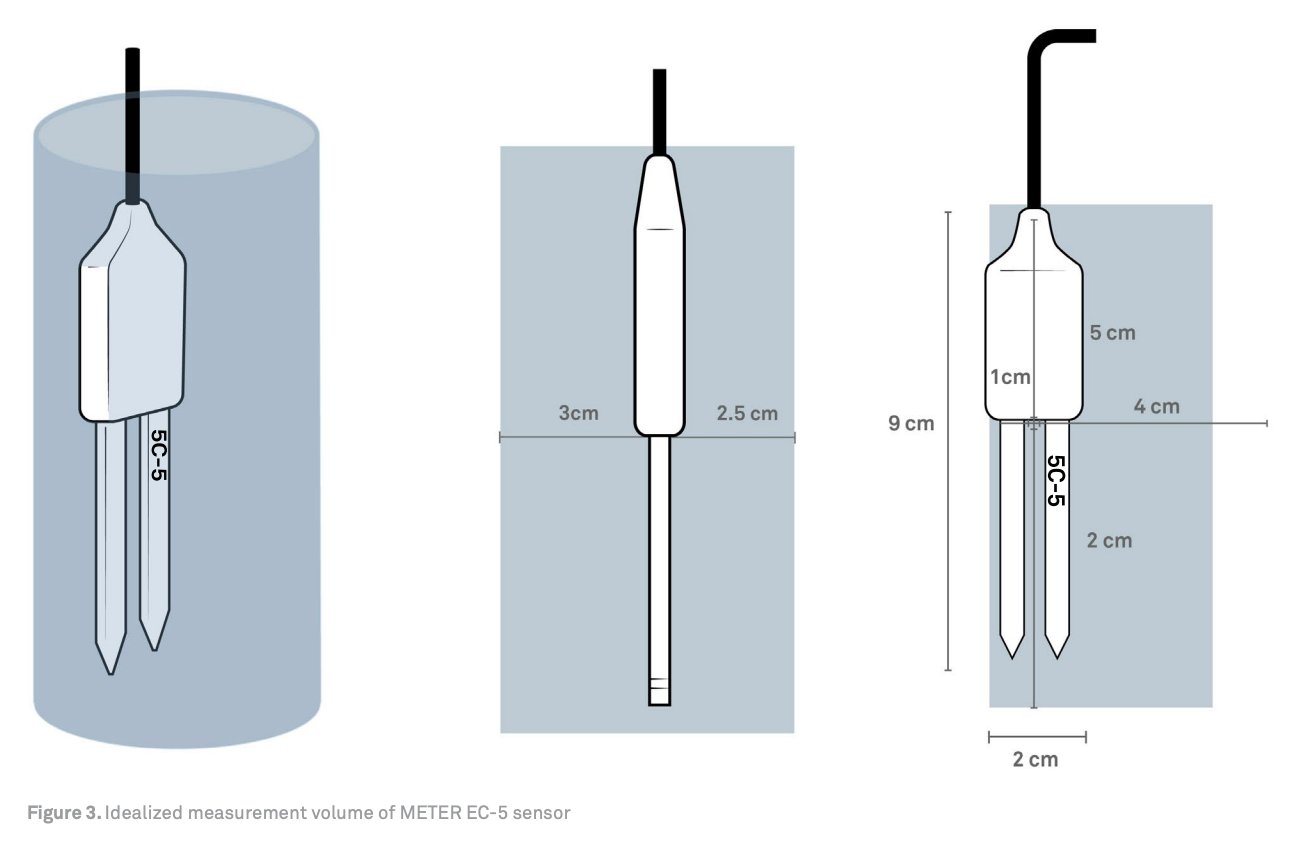 **Figure 1:** Folium Substrate Moisture sensor placement in substrate/soil ([source](https://metergroup.com/products/ech20-ec-5-soil-moisture-sensor/))
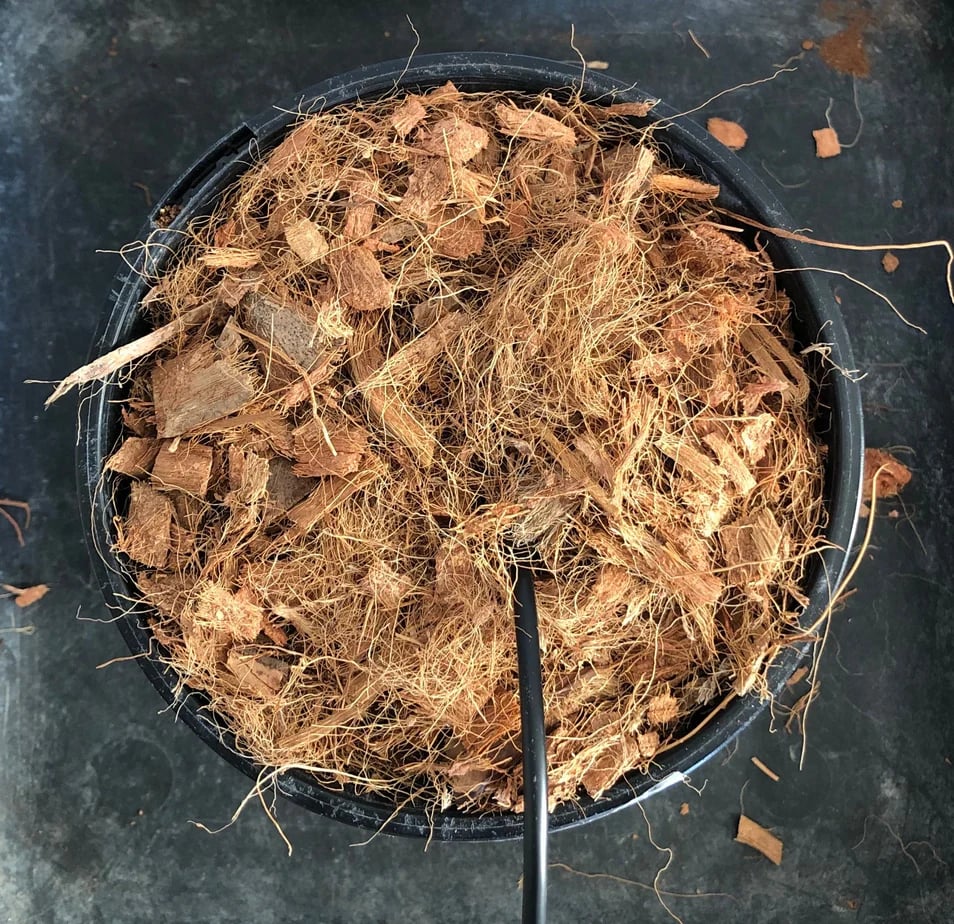 **Figure 2:** Folium Substrate Moisture sensor in coco-coir 50/50 substrate/soil
## Placement guidance
The Folium Substrate Moisture Sensor has a volume of influence of **240 mL**. The sensor readings are representative of an integrated volume of 240 ml substrate/soil around the sensor when installed as shown in Figure 1.
Through preliminary field tests, we have found that a **5 - 10 cm distance** of the Folium Substrate Moisture sensor from the dripper provides a representative moisture reading of the pot (Figure 3).
However, understanding of the wet bulb formation in the substrate/soil based on the irrigation/fertigation setup and schedule would further help determine the placement of the Folium Substrate Moisture sensors.
**Figure 2:** Folium Substrate Moisture sensor in coco-coir 50/50 substrate/soil
## Placement guidance
The Folium Substrate Moisture Sensor has a volume of influence of **240 mL**. The sensor readings are representative of an integrated volume of 240 ml substrate/soil around the sensor when installed as shown in Figure 1.
Through preliminary field tests, we have found that a **5 - 10 cm distance** of the Folium Substrate Moisture sensor from the dripper provides a representative moisture reading of the pot (Figure 3).
However, understanding of the wet bulb formation in the substrate/soil based on the irrigation/fertigation setup and schedule would further help determine the placement of the Folium Substrate Moisture sensors.
.webp?fit=max&auto=format&n=dteGjPaLhbNL38nw&q=85&s=7b3d4540efda058d8d904c6f225476b6) **Figure 3:** Folium Substrate Moisture sensor placement in substrate/soil (preliminary field tests)
## What can affect sensor readings?
Sensor readings can be affected by:
* the uniformity of the substrate or soil
* air gaps around the sensor
* differences between pots
* sensor depth and placement within the pot
* distance from the wall, bottom of the pot, and plant
* root development over time
* the distribution of water/nutrient mix in the substrate/soil
We recommend identifying a suitable pot location that meets the placement requirements.
Once identified, install the sensor and take the substrate moisture (VWC) readings. Repeat this for a couple more locations and in different pots to make sure the readings are representative of the pots. Then install the sensor in selected location and start collecting data.
As the roots grow the substrate/soil structure may change and and it may affect the readings as well.
## Installing multiple sensors in the same pot, bag, or soil zone
If you need to place more than one sensor in the same pot, bag, or soil area for measurement/testing, make sure the volume of influence for each sensor does not overlap, as shown in Figure 4. Also ensure each sensor is placed according to the requirements shown in Figure 1 for Folium Substrate Moisture sensor.
The volume of influence for Folium Substrate Moisture sensor is different from other sensors substrate/soil sensors.
**Figure 3:** Folium Substrate Moisture sensor placement in substrate/soil (preliminary field tests)
## What can affect sensor readings?
Sensor readings can be affected by:
* the uniformity of the substrate or soil
* air gaps around the sensor
* differences between pots
* sensor depth and placement within the pot
* distance from the wall, bottom of the pot, and plant
* root development over time
* the distribution of water/nutrient mix in the substrate/soil
We recommend identifying a suitable pot location that meets the placement requirements.
Once identified, install the sensor and take the substrate moisture (VWC) readings. Repeat this for a couple more locations and in different pots to make sure the readings are representative of the pots. Then install the sensor in selected location and start collecting data.
As the roots grow the substrate/soil structure may change and and it may affect the readings as well.
## Installing multiple sensors in the same pot, bag, or soil zone
If you need to place more than one sensor in the same pot, bag, or soil area for measurement/testing, make sure the volume of influence for each sensor does not overlap, as shown in Figure 4. Also ensure each sensor is placed according to the requirements shown in Figure 1 for Folium Substrate Moisture sensor.
The volume of influence for Folium Substrate Moisture sensor is different from other sensors substrate/soil sensors.
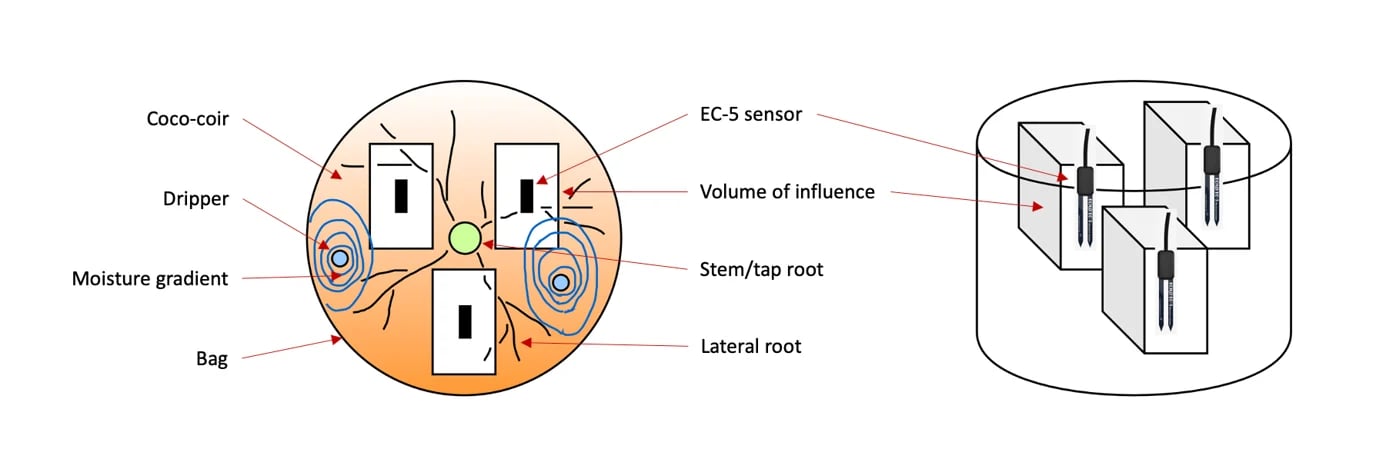 **Figure 4:** Non-overlapping volumes of influence for placing more than one sensor in the same pot
## View measurements in FarmRoad Data Studio
You can visualize substrate moisture sensor data in a graph using FarmRoad Data Studio. What you want to see in the graph are irrigation peaks and drying down. For best results, install the sensor near a dripper, typically one located in the center of the slab.
Start by installing the sensor near the dripper on the side of the slab. Then monitor moisture patterns in FarmRoad Data Studio by creating a graph for the test sensor. If the area remains consistently wet, the graph will display a flat line.
**Figure 4:** Non-overlapping volumes of influence for placing more than one sensor in the same pot
## View measurements in FarmRoad Data Studio
You can visualize substrate moisture sensor data in a graph using FarmRoad Data Studio. What you want to see in the graph are irrigation peaks and drying down. For best results, install the sensor near a dripper, typically one located in the center of the slab.
Start by installing the sensor near the dripper on the side of the slab. Then monitor moisture patterns in FarmRoad Data Studio by creating a graph for the test sensor. If the area remains consistently wet, the graph will display a flat line.
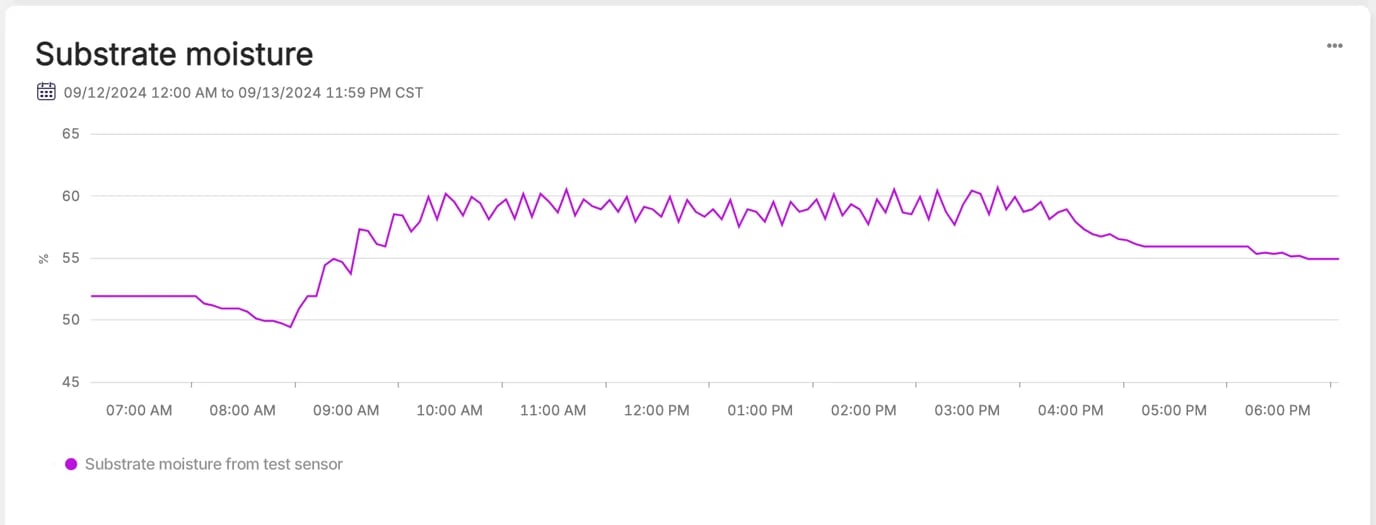 *Note: In this graph, there is very little fluctuation of moisture levels without clear peaks as the moisture sensor is too close to the dripper*
If this happens, gradually move the sensor further away from the dripper until the graph shows clearer peaks and drying down. If you are using multiple sensors, repeat this process across other slabs until you see a similar pattern.
After installation, regularly check that the sensors remain intact and continue monitoring the data in Data Studio to confirm that you are seeing the expected peaks and drying patterns.
*Note: In this graph, there is very little fluctuation of moisture levels without clear peaks as the moisture sensor is too close to the dripper*
If this happens, gradually move the sensor further away from the dripper until the graph shows clearer peaks and drying down. If you are using multiple sensors, repeat this process across other slabs until you see a similar pattern.
After installation, regularly check that the sensors remain intact and continue monitoring the data in Data Studio to confirm that you are seeing the expected peaks and drying patterns.
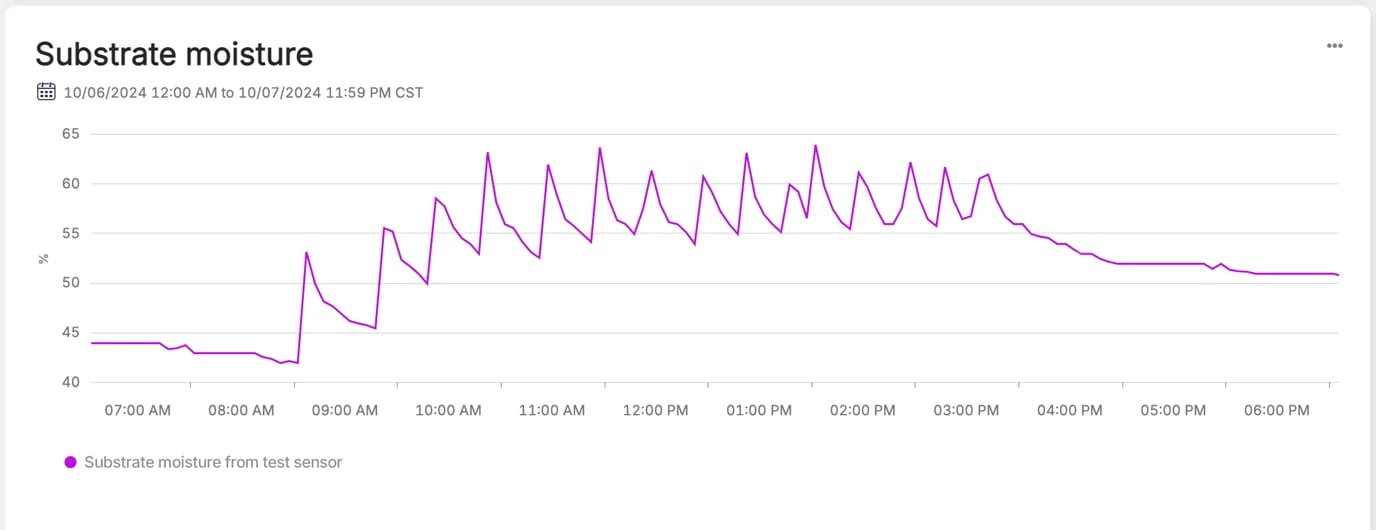 *Substrate moisture graph in FarmRoad showing clear irrigation peaks and drying down between irrigations*