> ## Documentation Index
> Fetch the complete documentation index at: https://waybeyond.mintlify.site/llms.txt
> Use this file to discover all available pages before exploring further.
# How do I create and manage graphs on a dashboard?
FarmRoad Data Studio allows you to easily create and manage your graphs on any dashboard.
## Create a graph
1. Click on the **Data Studio** icon in the app menu.
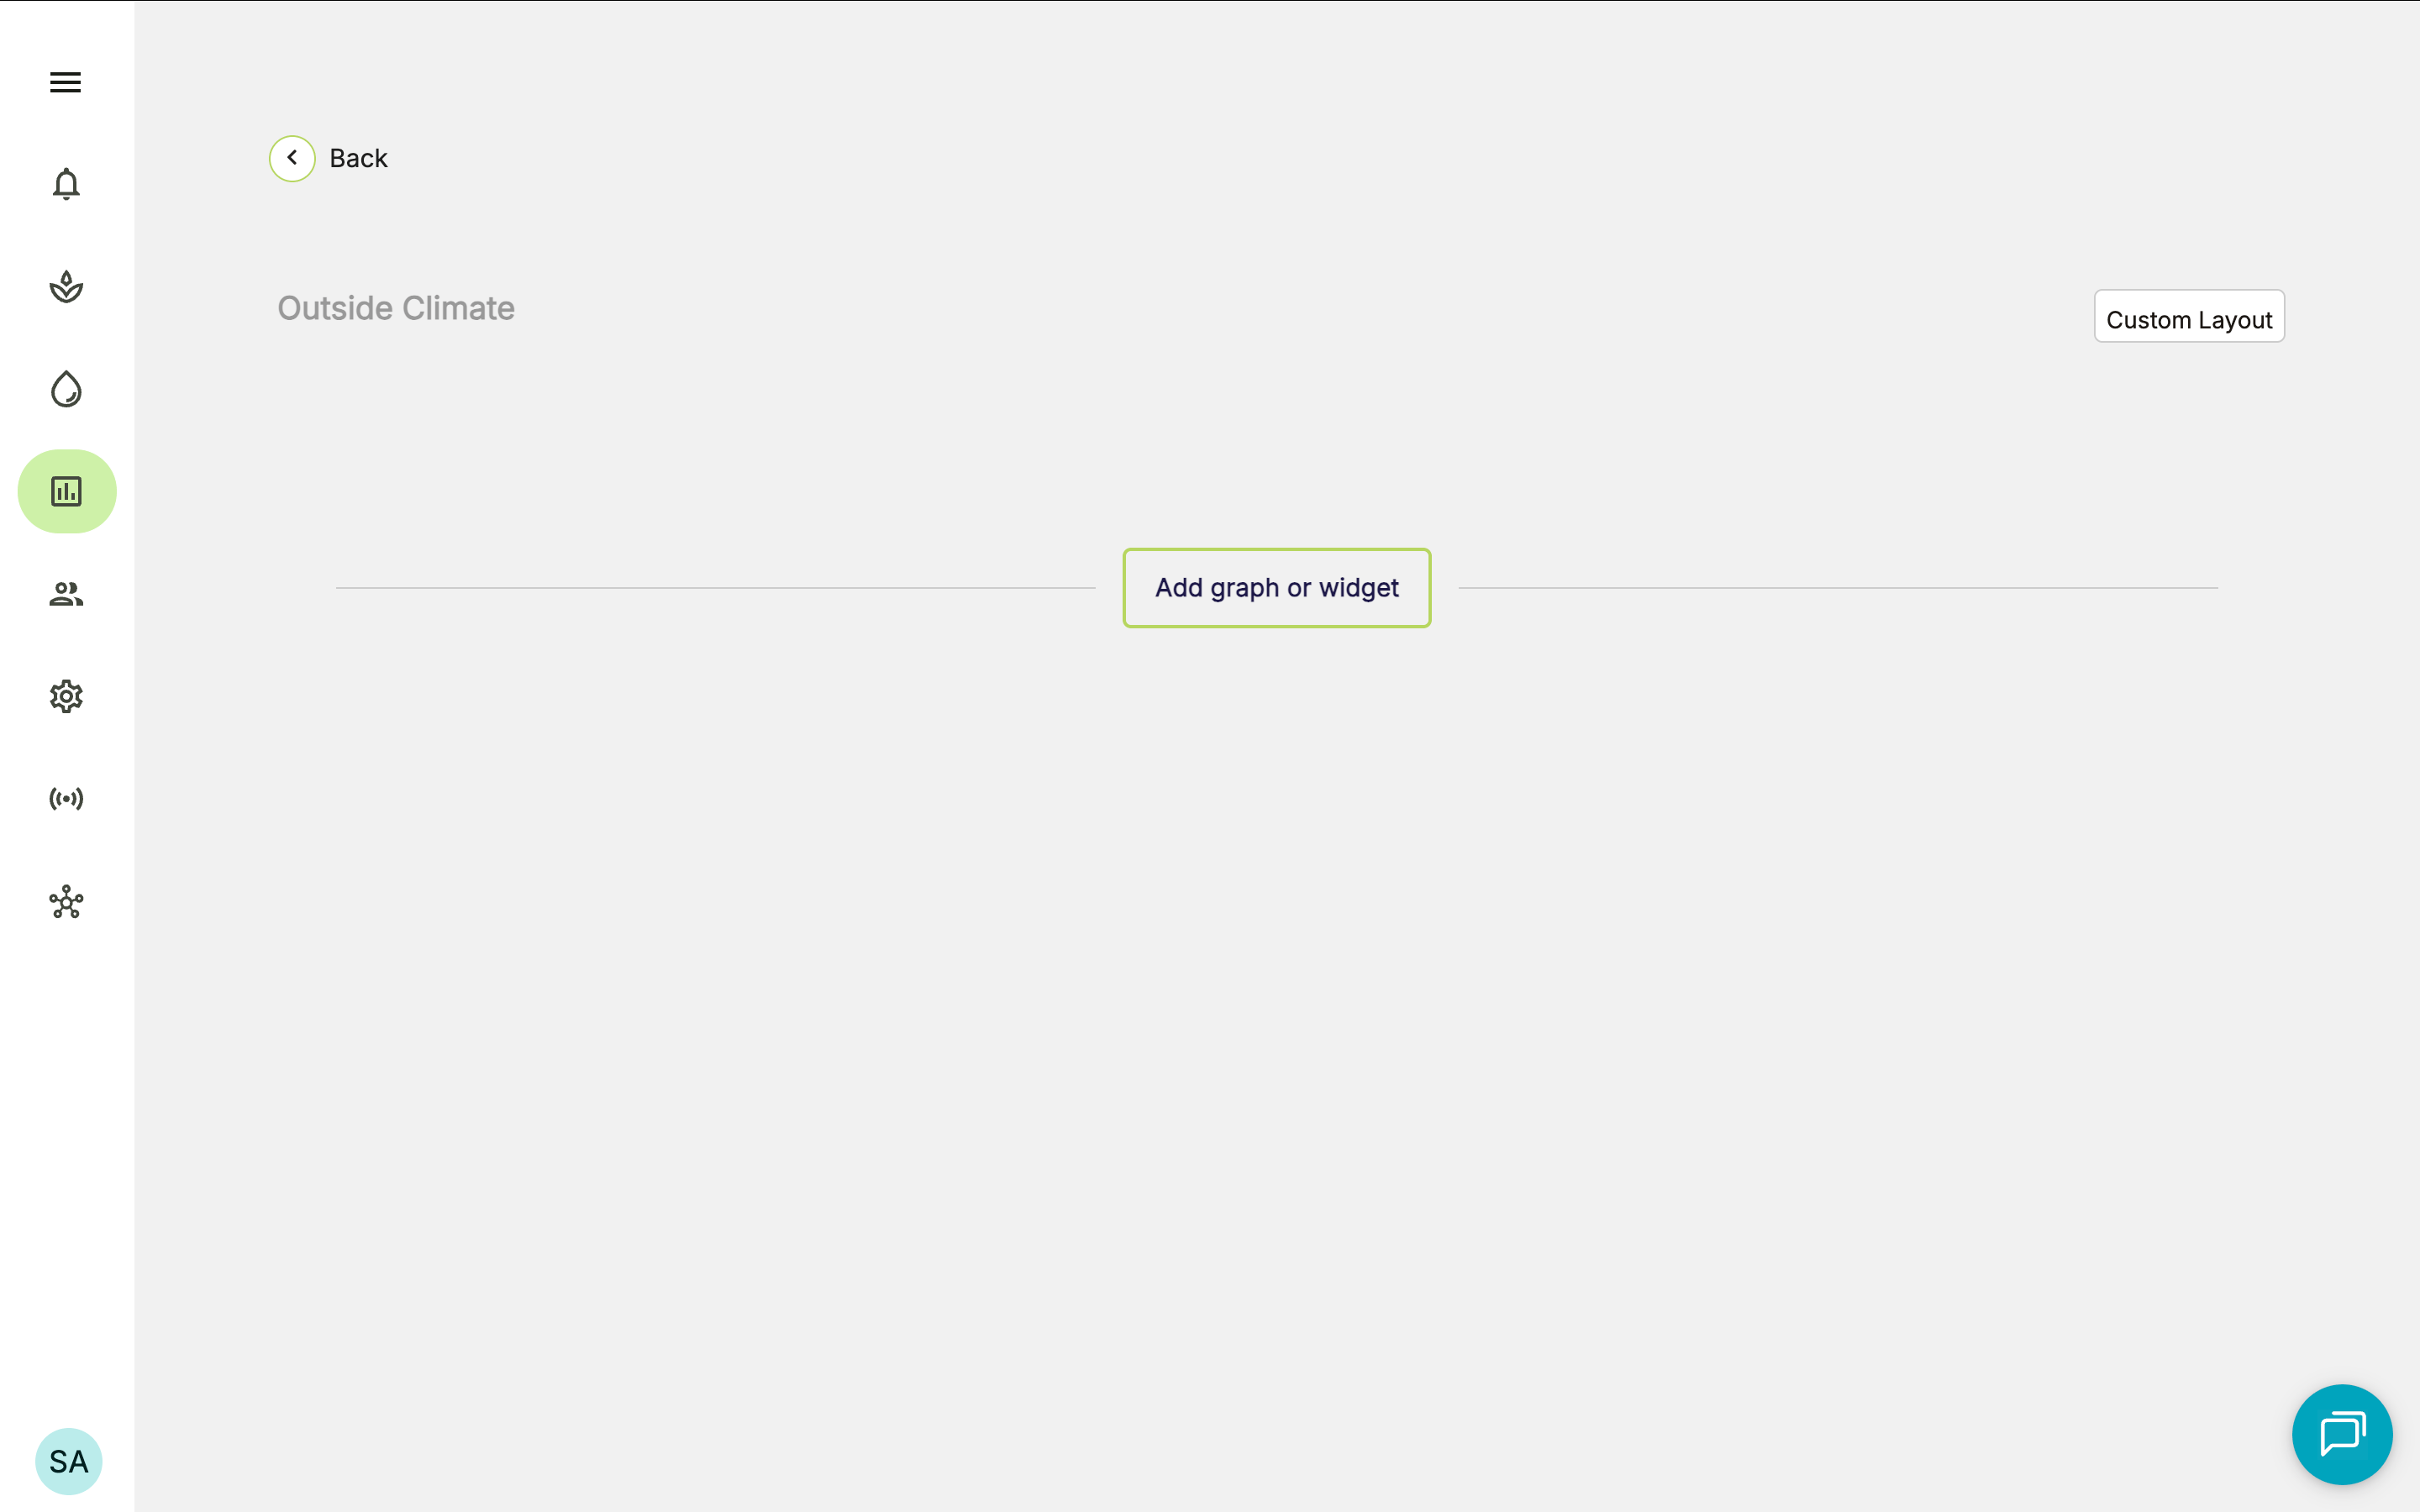
2. Click **Add graph or widget** at the middle of the page.
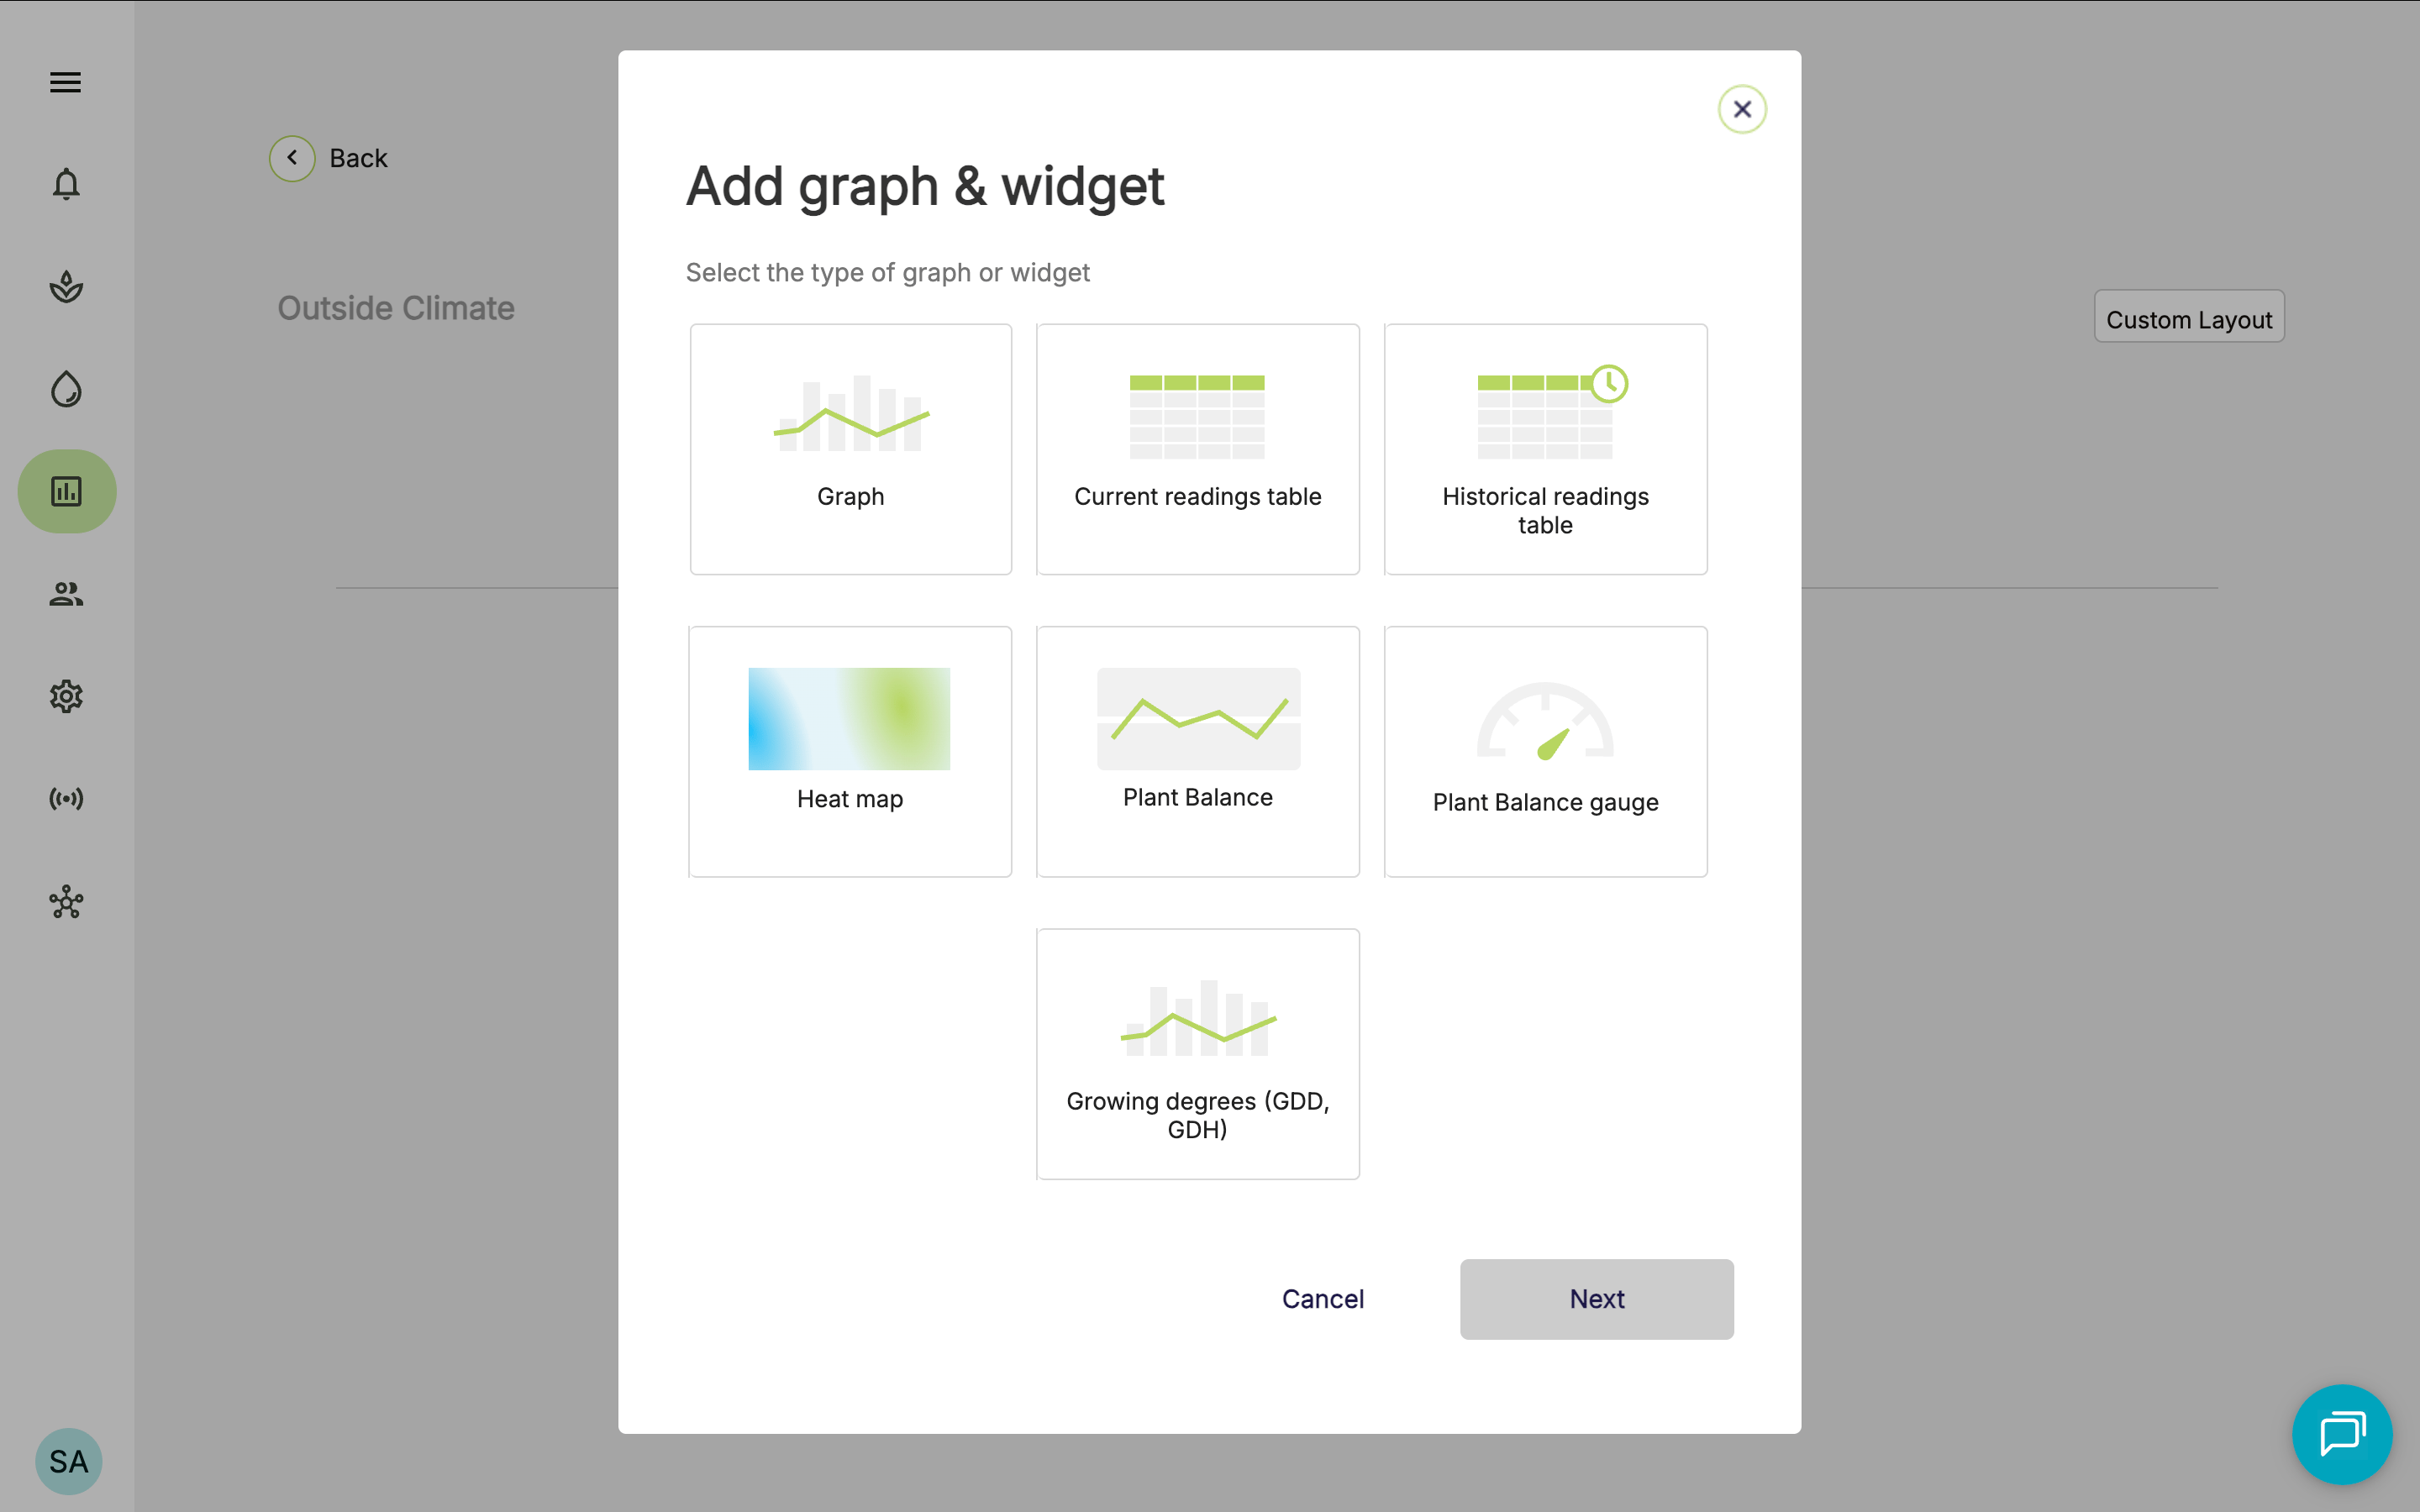
 3. Select **Graph**.
 3. Enter a name for the graph.
4. Click **Done**.
## Add data to a graph
1. Click on the **Data Studio** icon in the app menu.
2. Go to your dashboard.
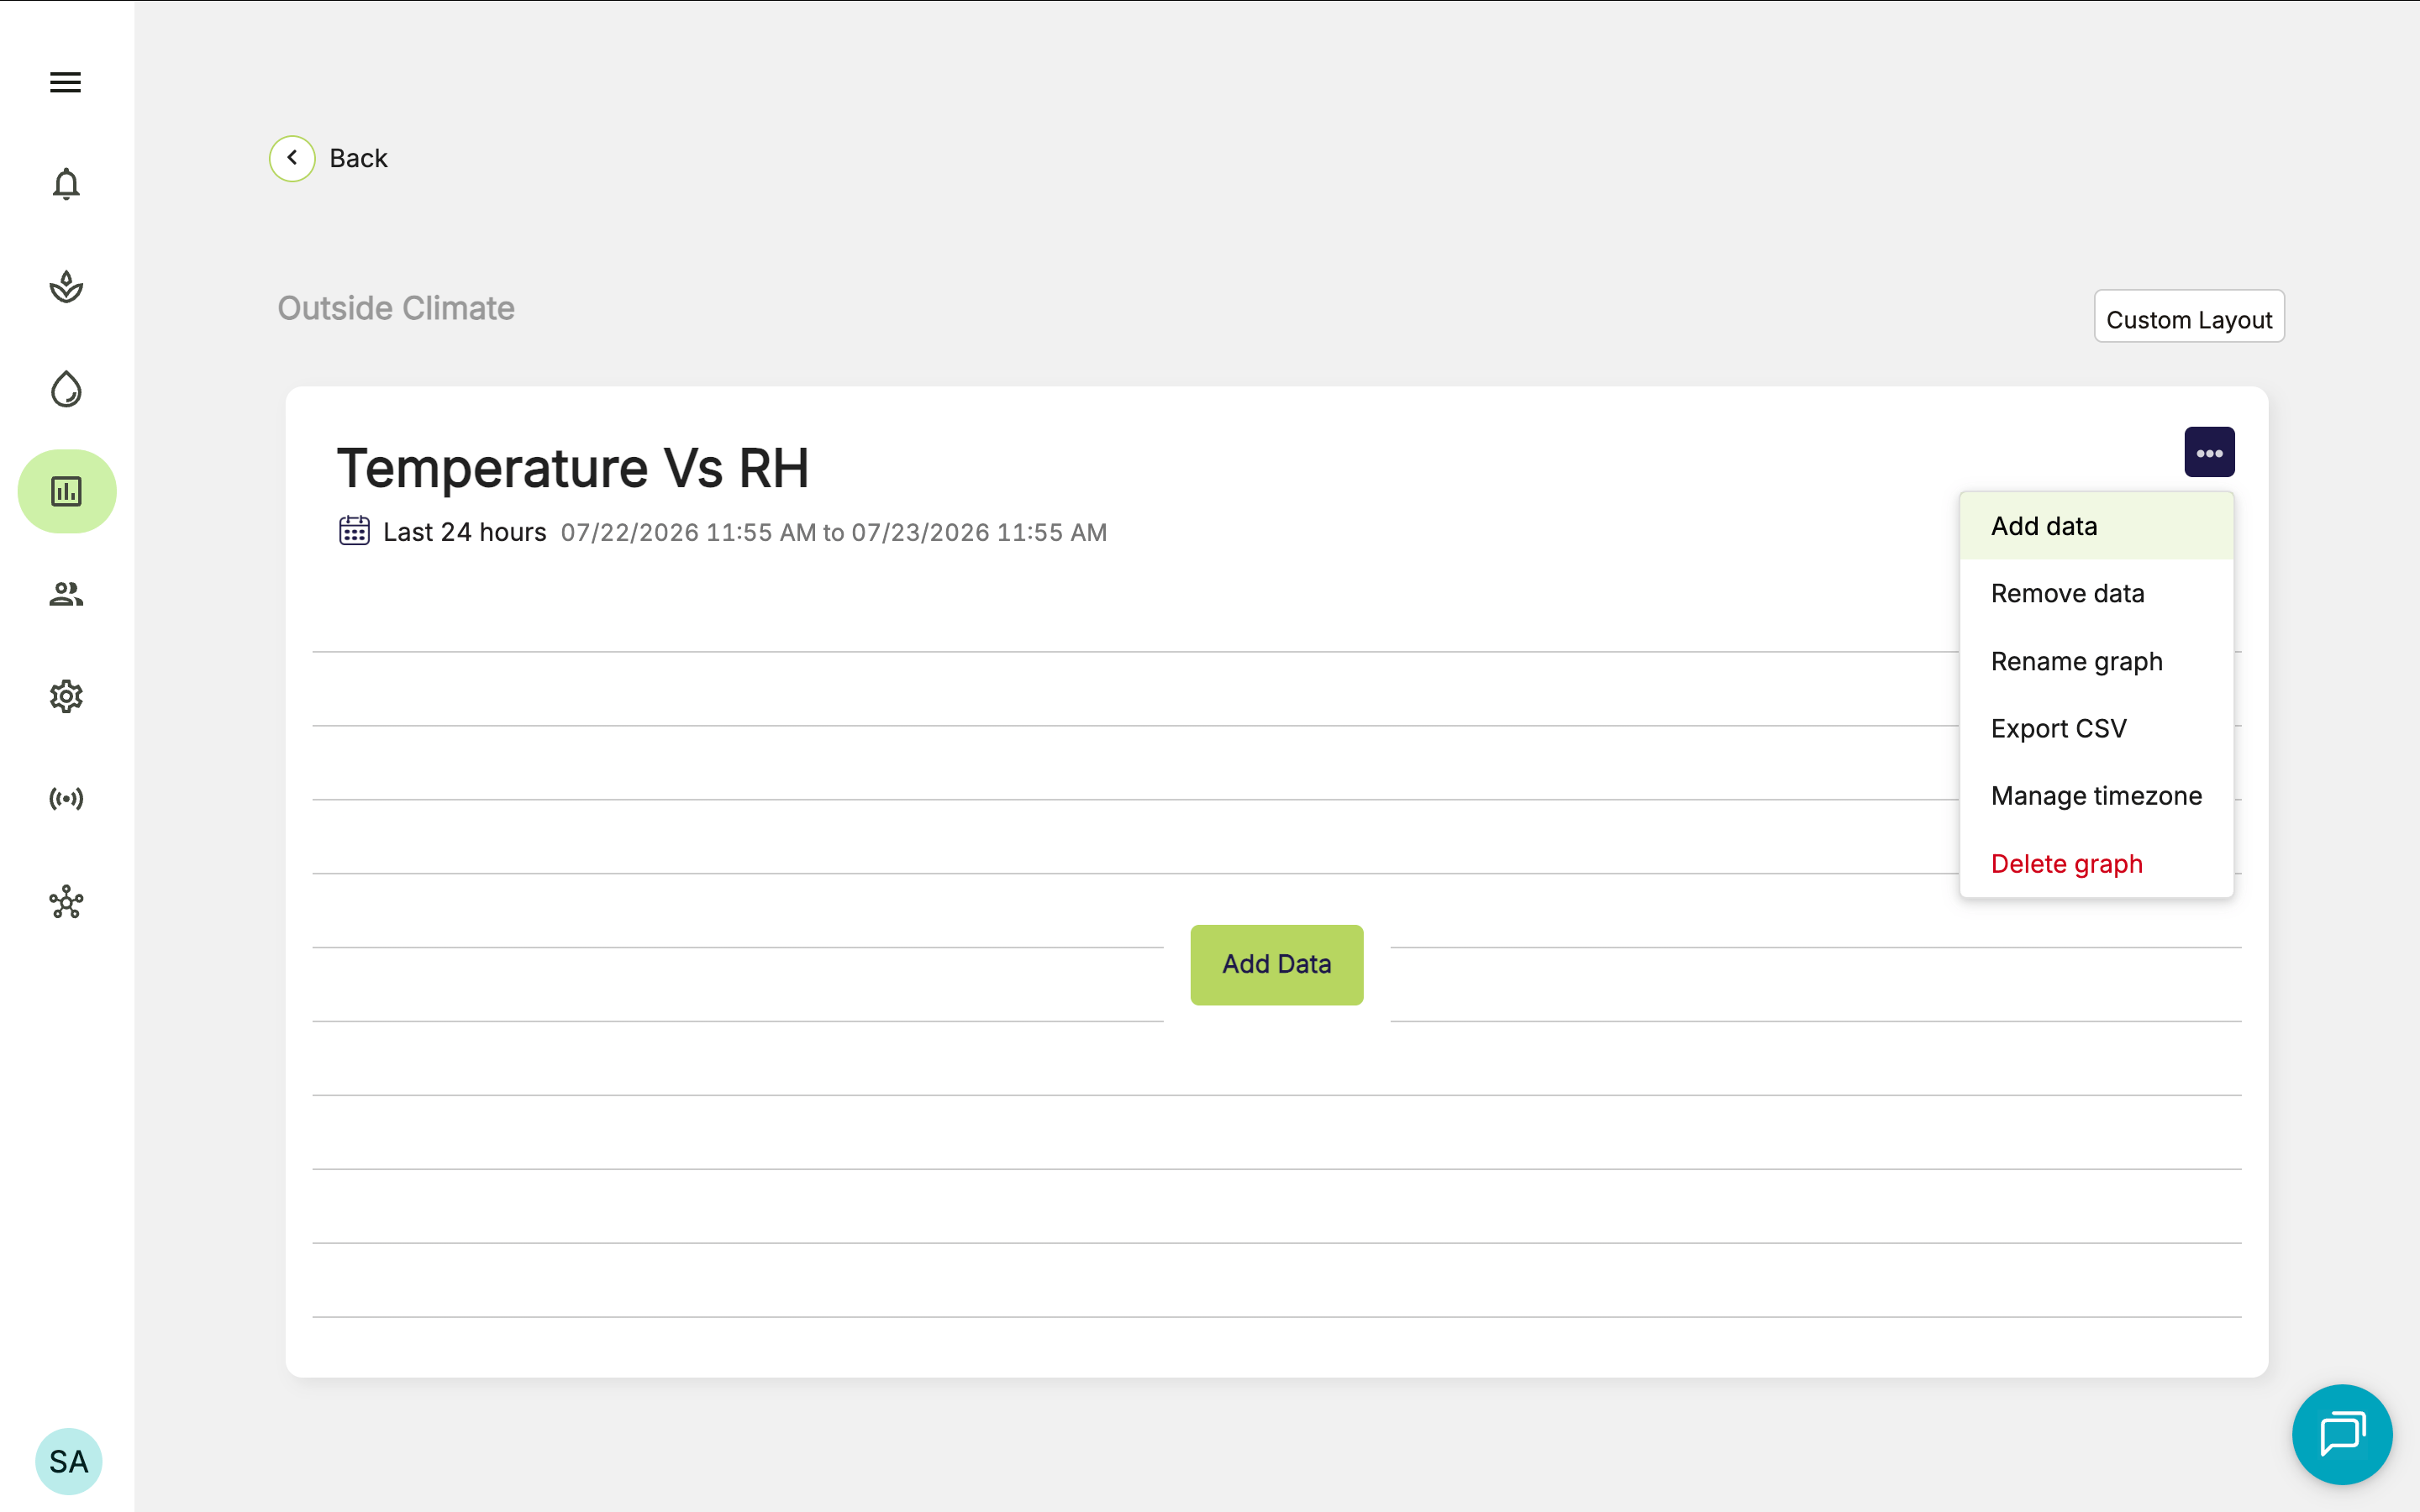
3. Open the overflow menu on the graph you want to update.
4. Click **Add Data**.
3. Enter a name for the graph.
4. Click **Done**.
## Add data to a graph
1. Click on the **Data Studio** icon in the app menu.
2. Go to your dashboard.
3. Open the overflow menu on the graph you want to update.
4. Click **Add Data**.
 5. Choose the data you want to display. You can add two types of data to a graph:
1. **Sector data:** Use sector data to graph data collected at the sector level.
5. Choose the data you want to display. You can add two types of data to a graph:
1. **Sector data:** Use sector data to graph data collected at the sector level.
If multiple data points exist for the same timestamp, FarmRoad Data Studio averages those values before displaying them on the graph.
For example, if four sensors in the same sector record humidity at the same time, the graph will show the average humidity reading for that sector
2. **Individual sensor data:** Use sensor data to graph readings from one or more sensors connected to your FarmRoad account.
3. **Drip and drain stations:** Use data from drip irrigation stations setup on your FarmRoad account.
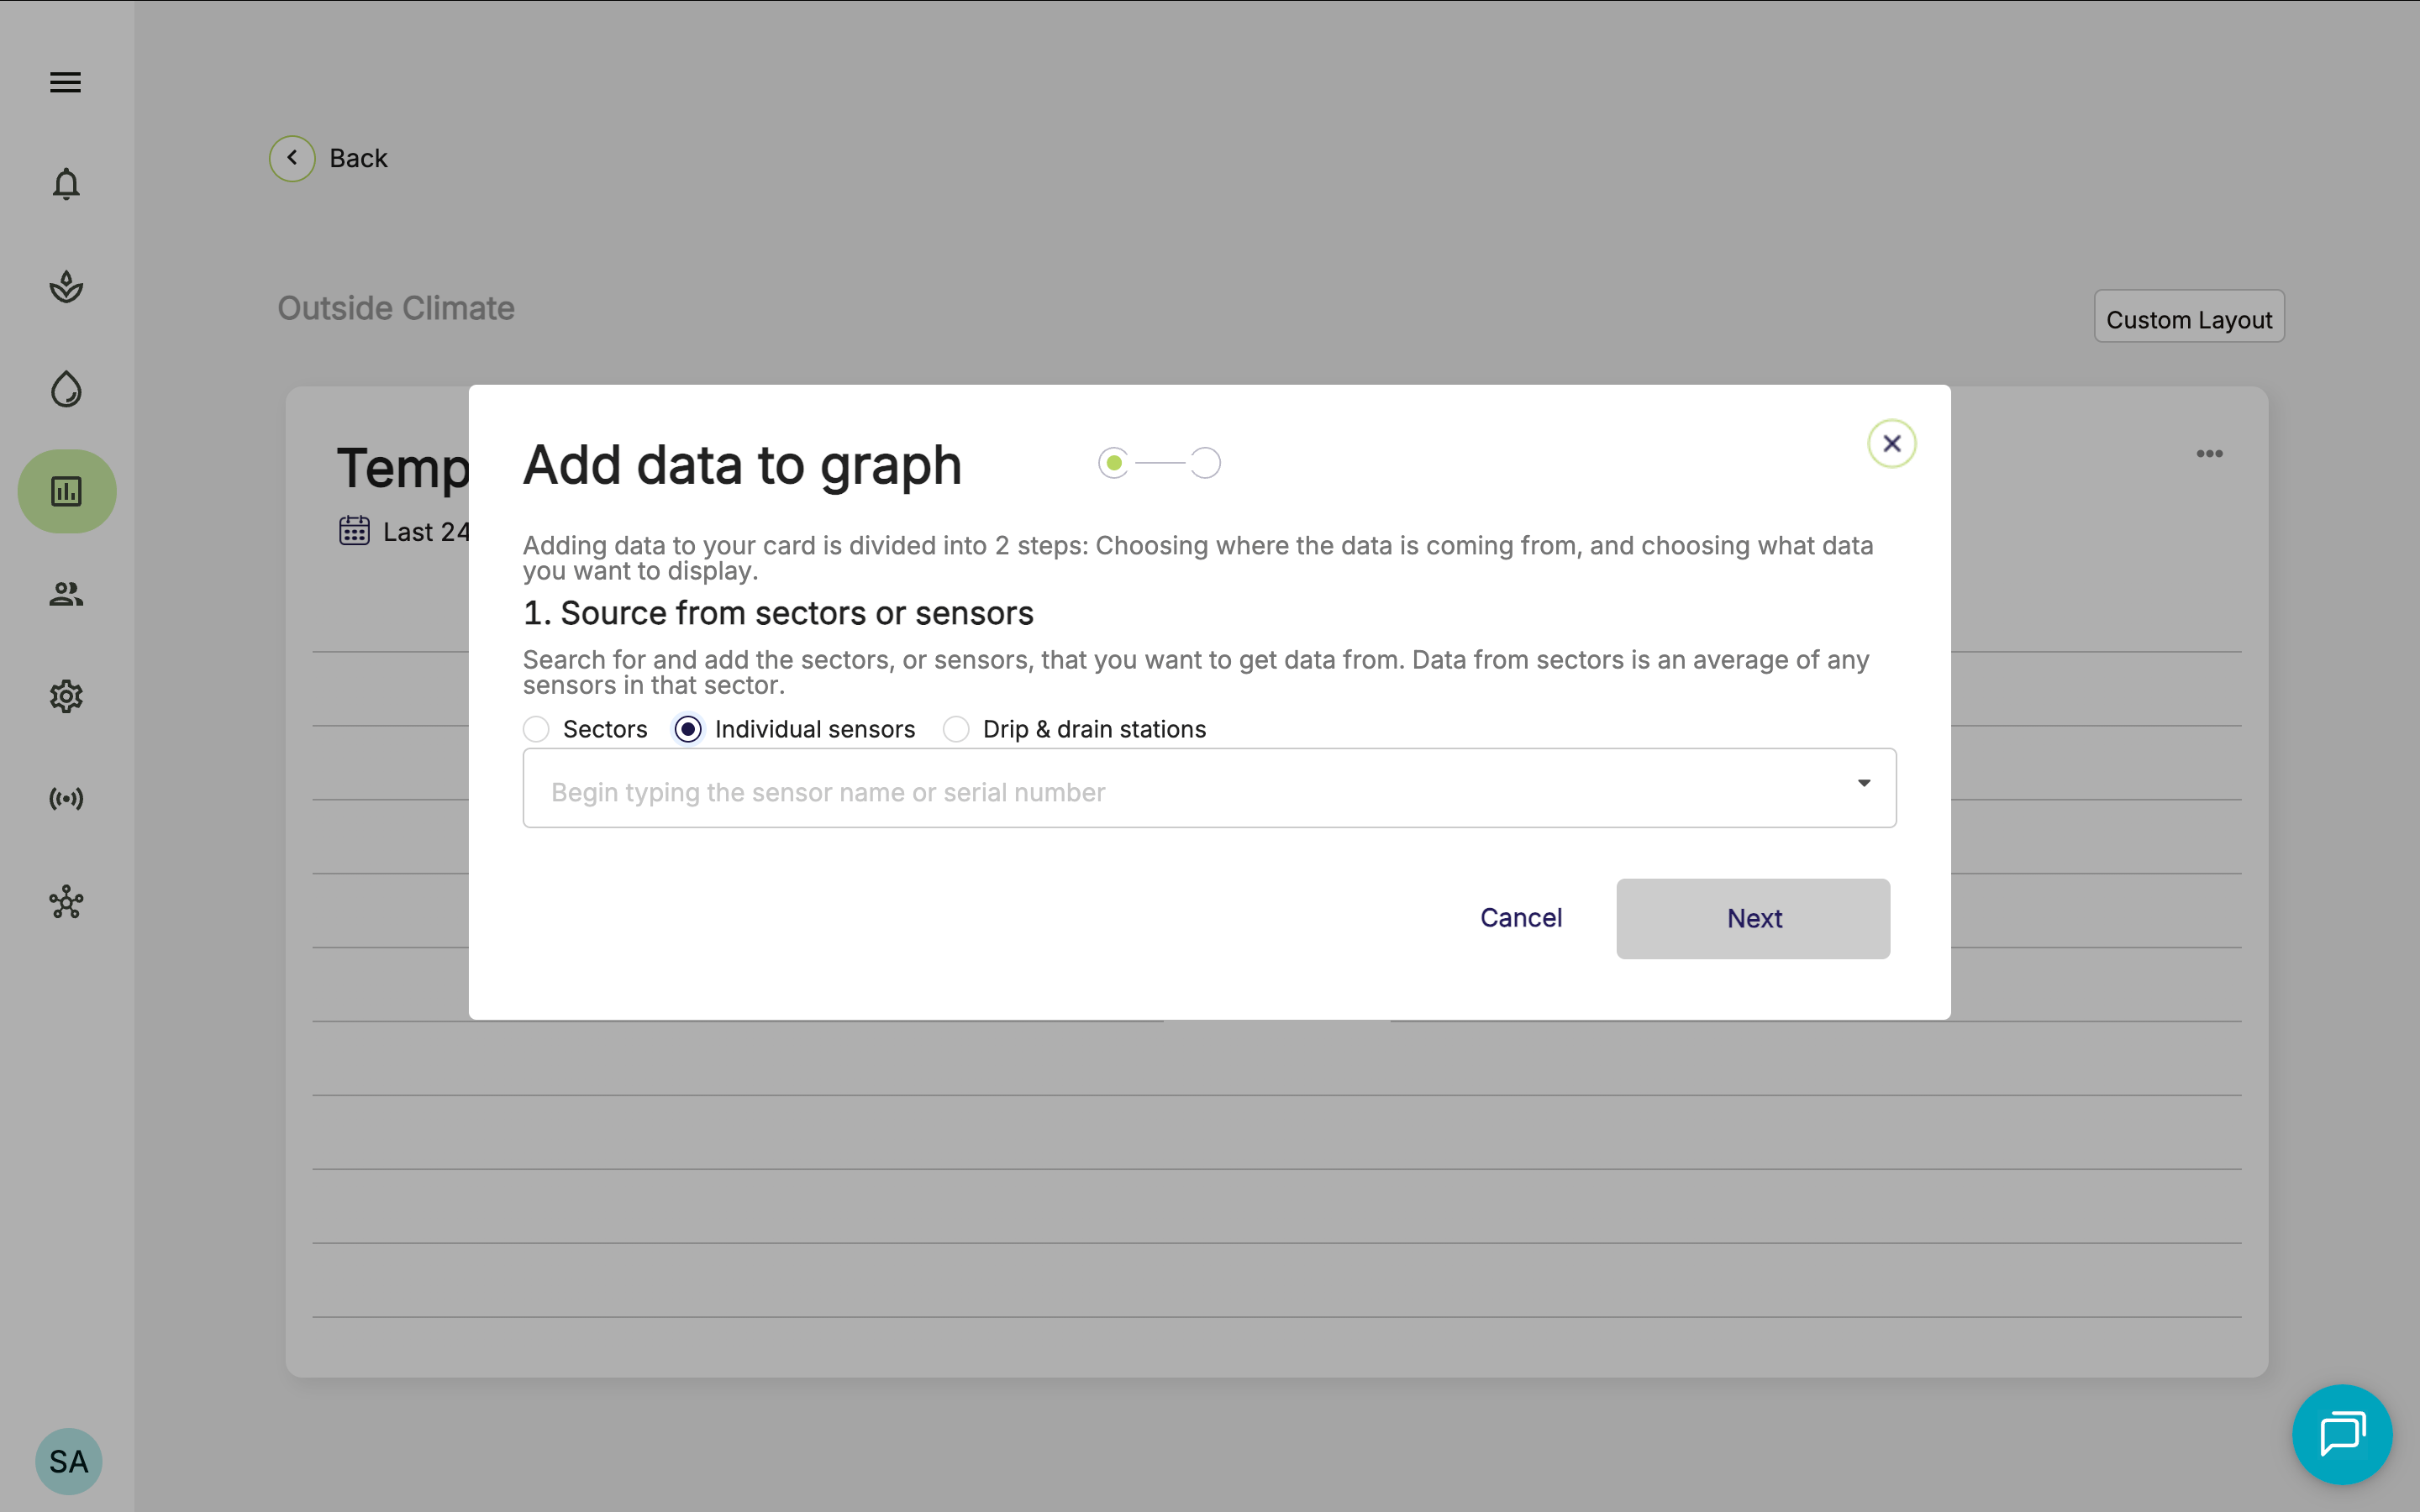 6. After selecting your sensors, choose the **datasets** you want to display. These datasets show the raw data received from the selected sensors.
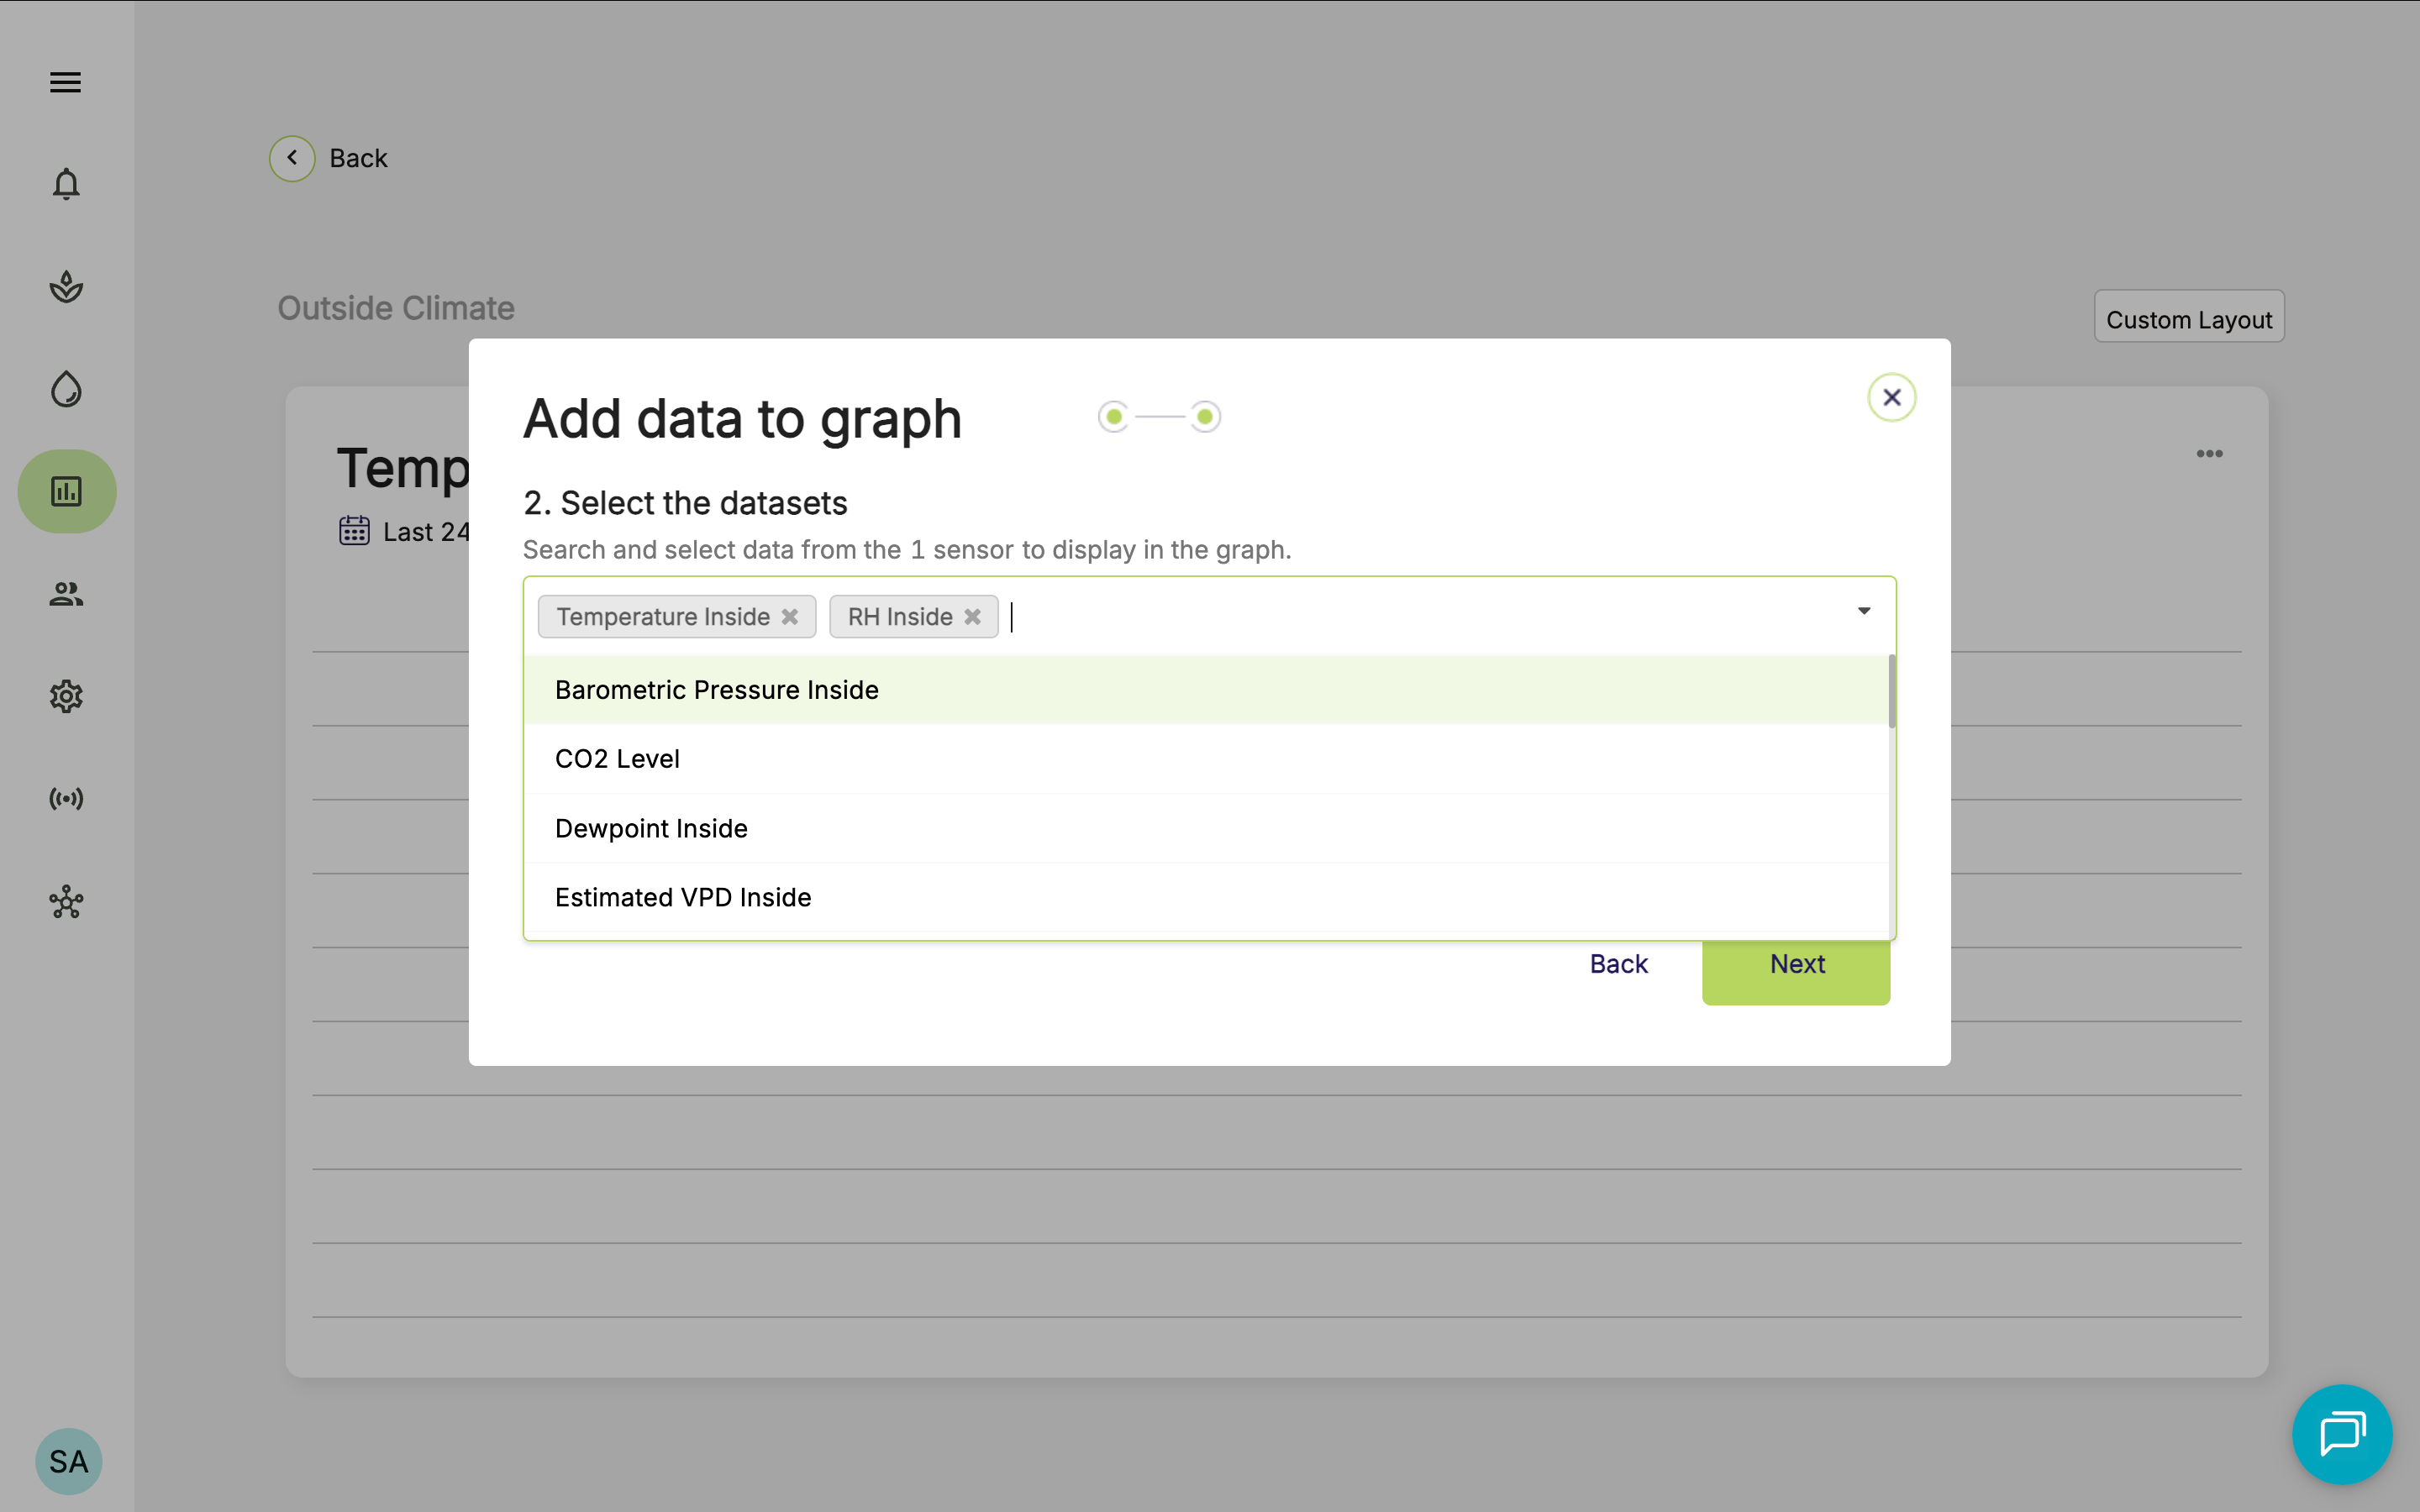 7. You can also choose how the data is presented:
**Chart style:** Select **Line** or **Bar**
**Display type:** Select **Instant** or **Accumulated**
1. **Instant**: Shows the raw measurements recorded by the selected sensors.
2. **Accumulated**: Adds measurements over time. This is useful for datasets such as accumulated radiation or CO2.
You can add as many graphs as you need to a single dashboard.
## View and explore a graph
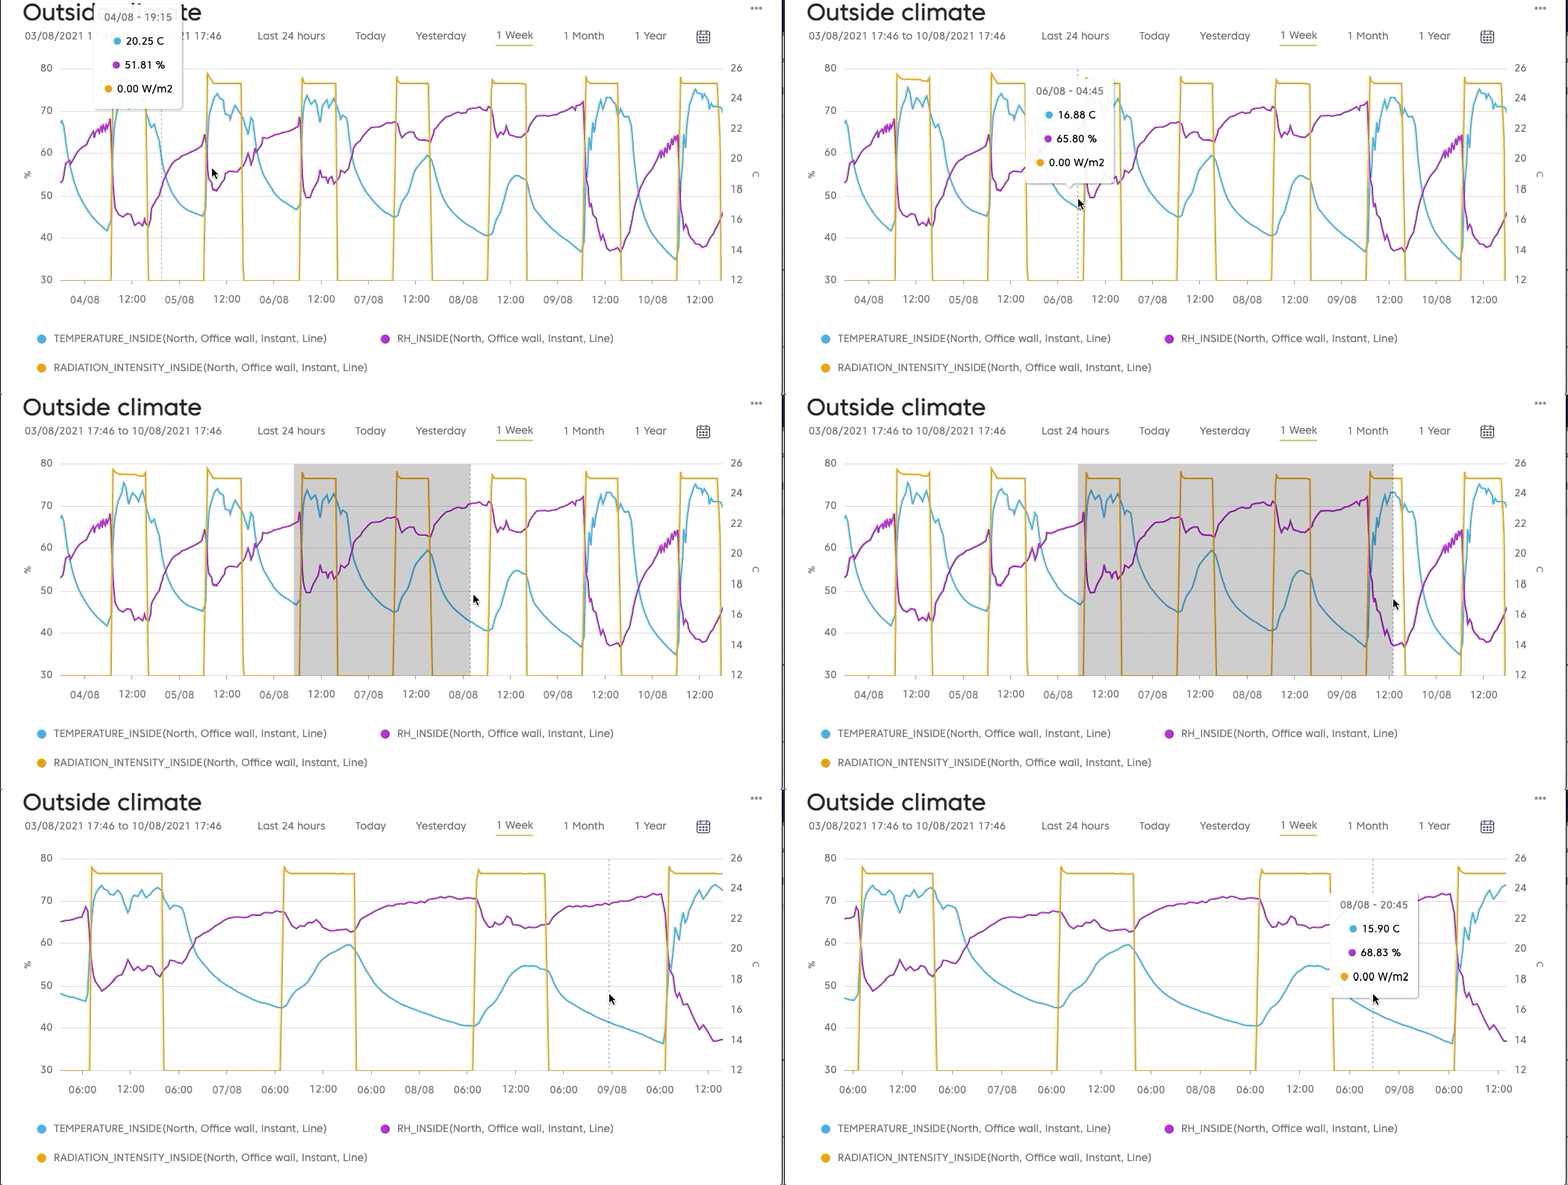
You can interact with graphs in several ways:
* Use the date picker to change the time range
* Hover over the graph to view a tooltip
* Click and drag to zoom in on a section of the graph
* Click the **green zoom-out icon** to return to the full view
 ## Remove data from a graph
1. Go to your dashboard.
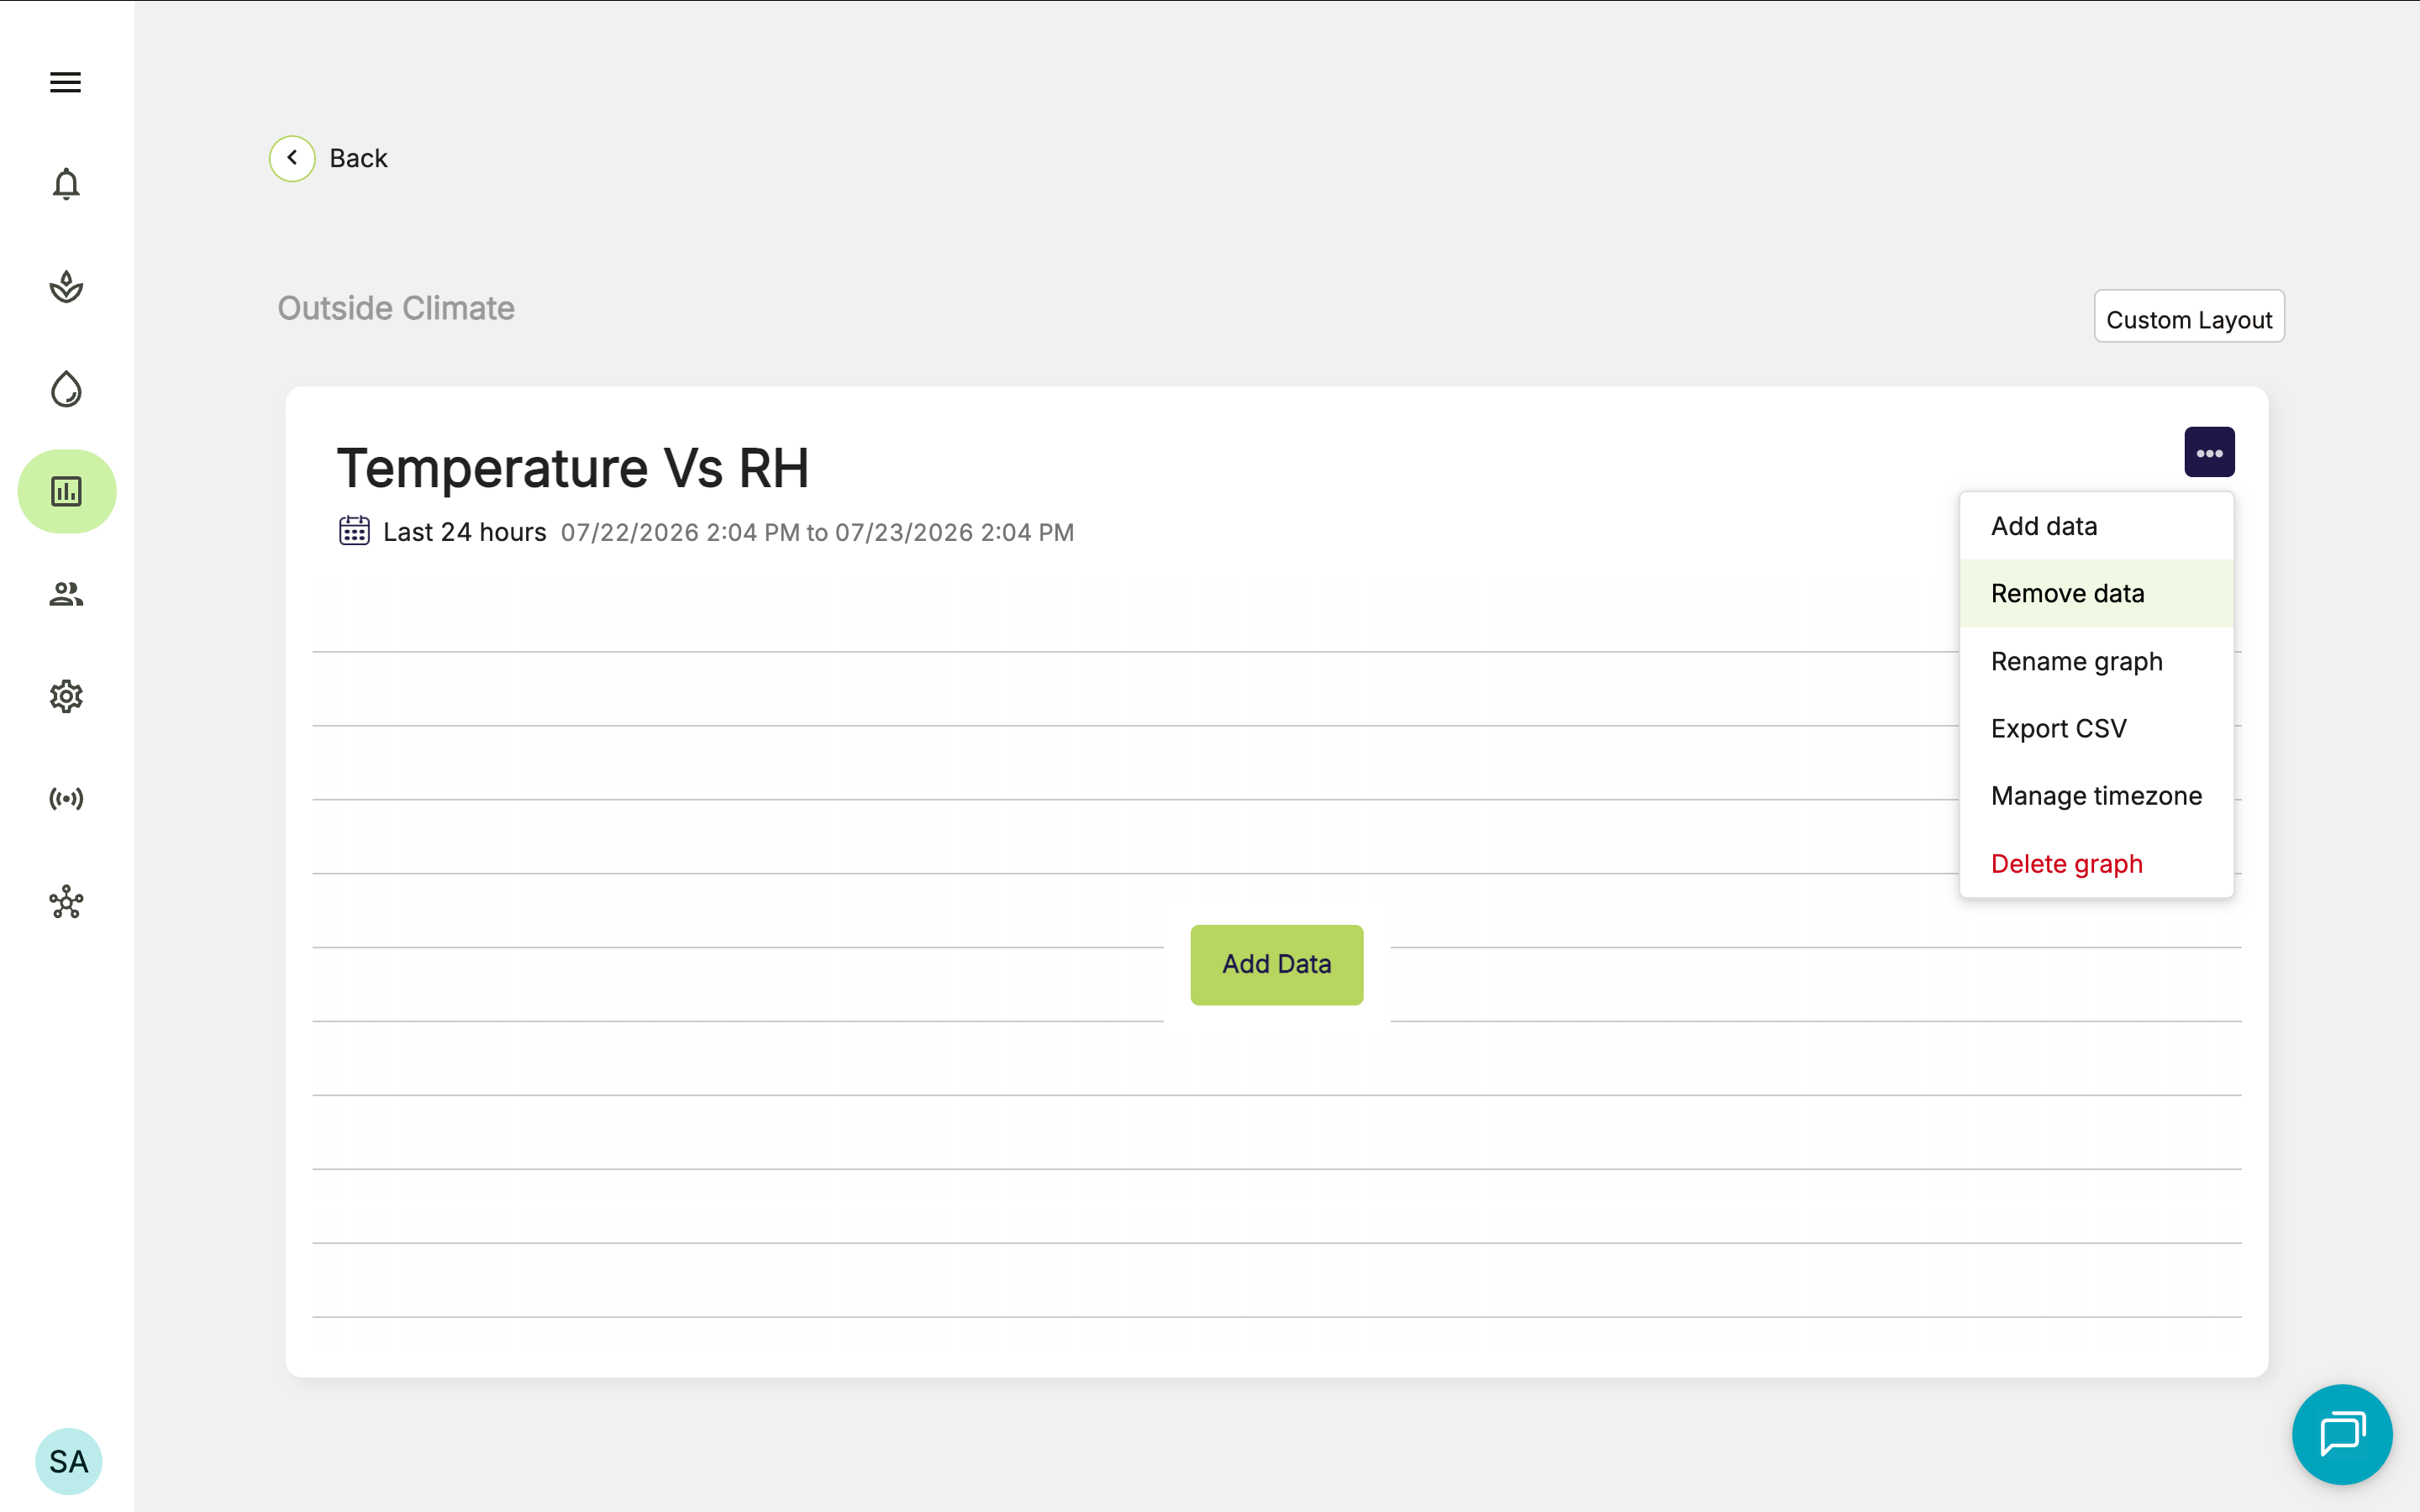
2. Open the overflow menu on the graph you want to update.
3. Click **Remove Data**.
4. Deselect the dataset you want to remove.
5. Click **Done**.
## Remove data from a graph
1. Go to your dashboard.
2. Open the overflow menu on the graph you want to update.
3. Click **Remove Data**.
4. Deselect the dataset you want to remove.
5. Click **Done**.
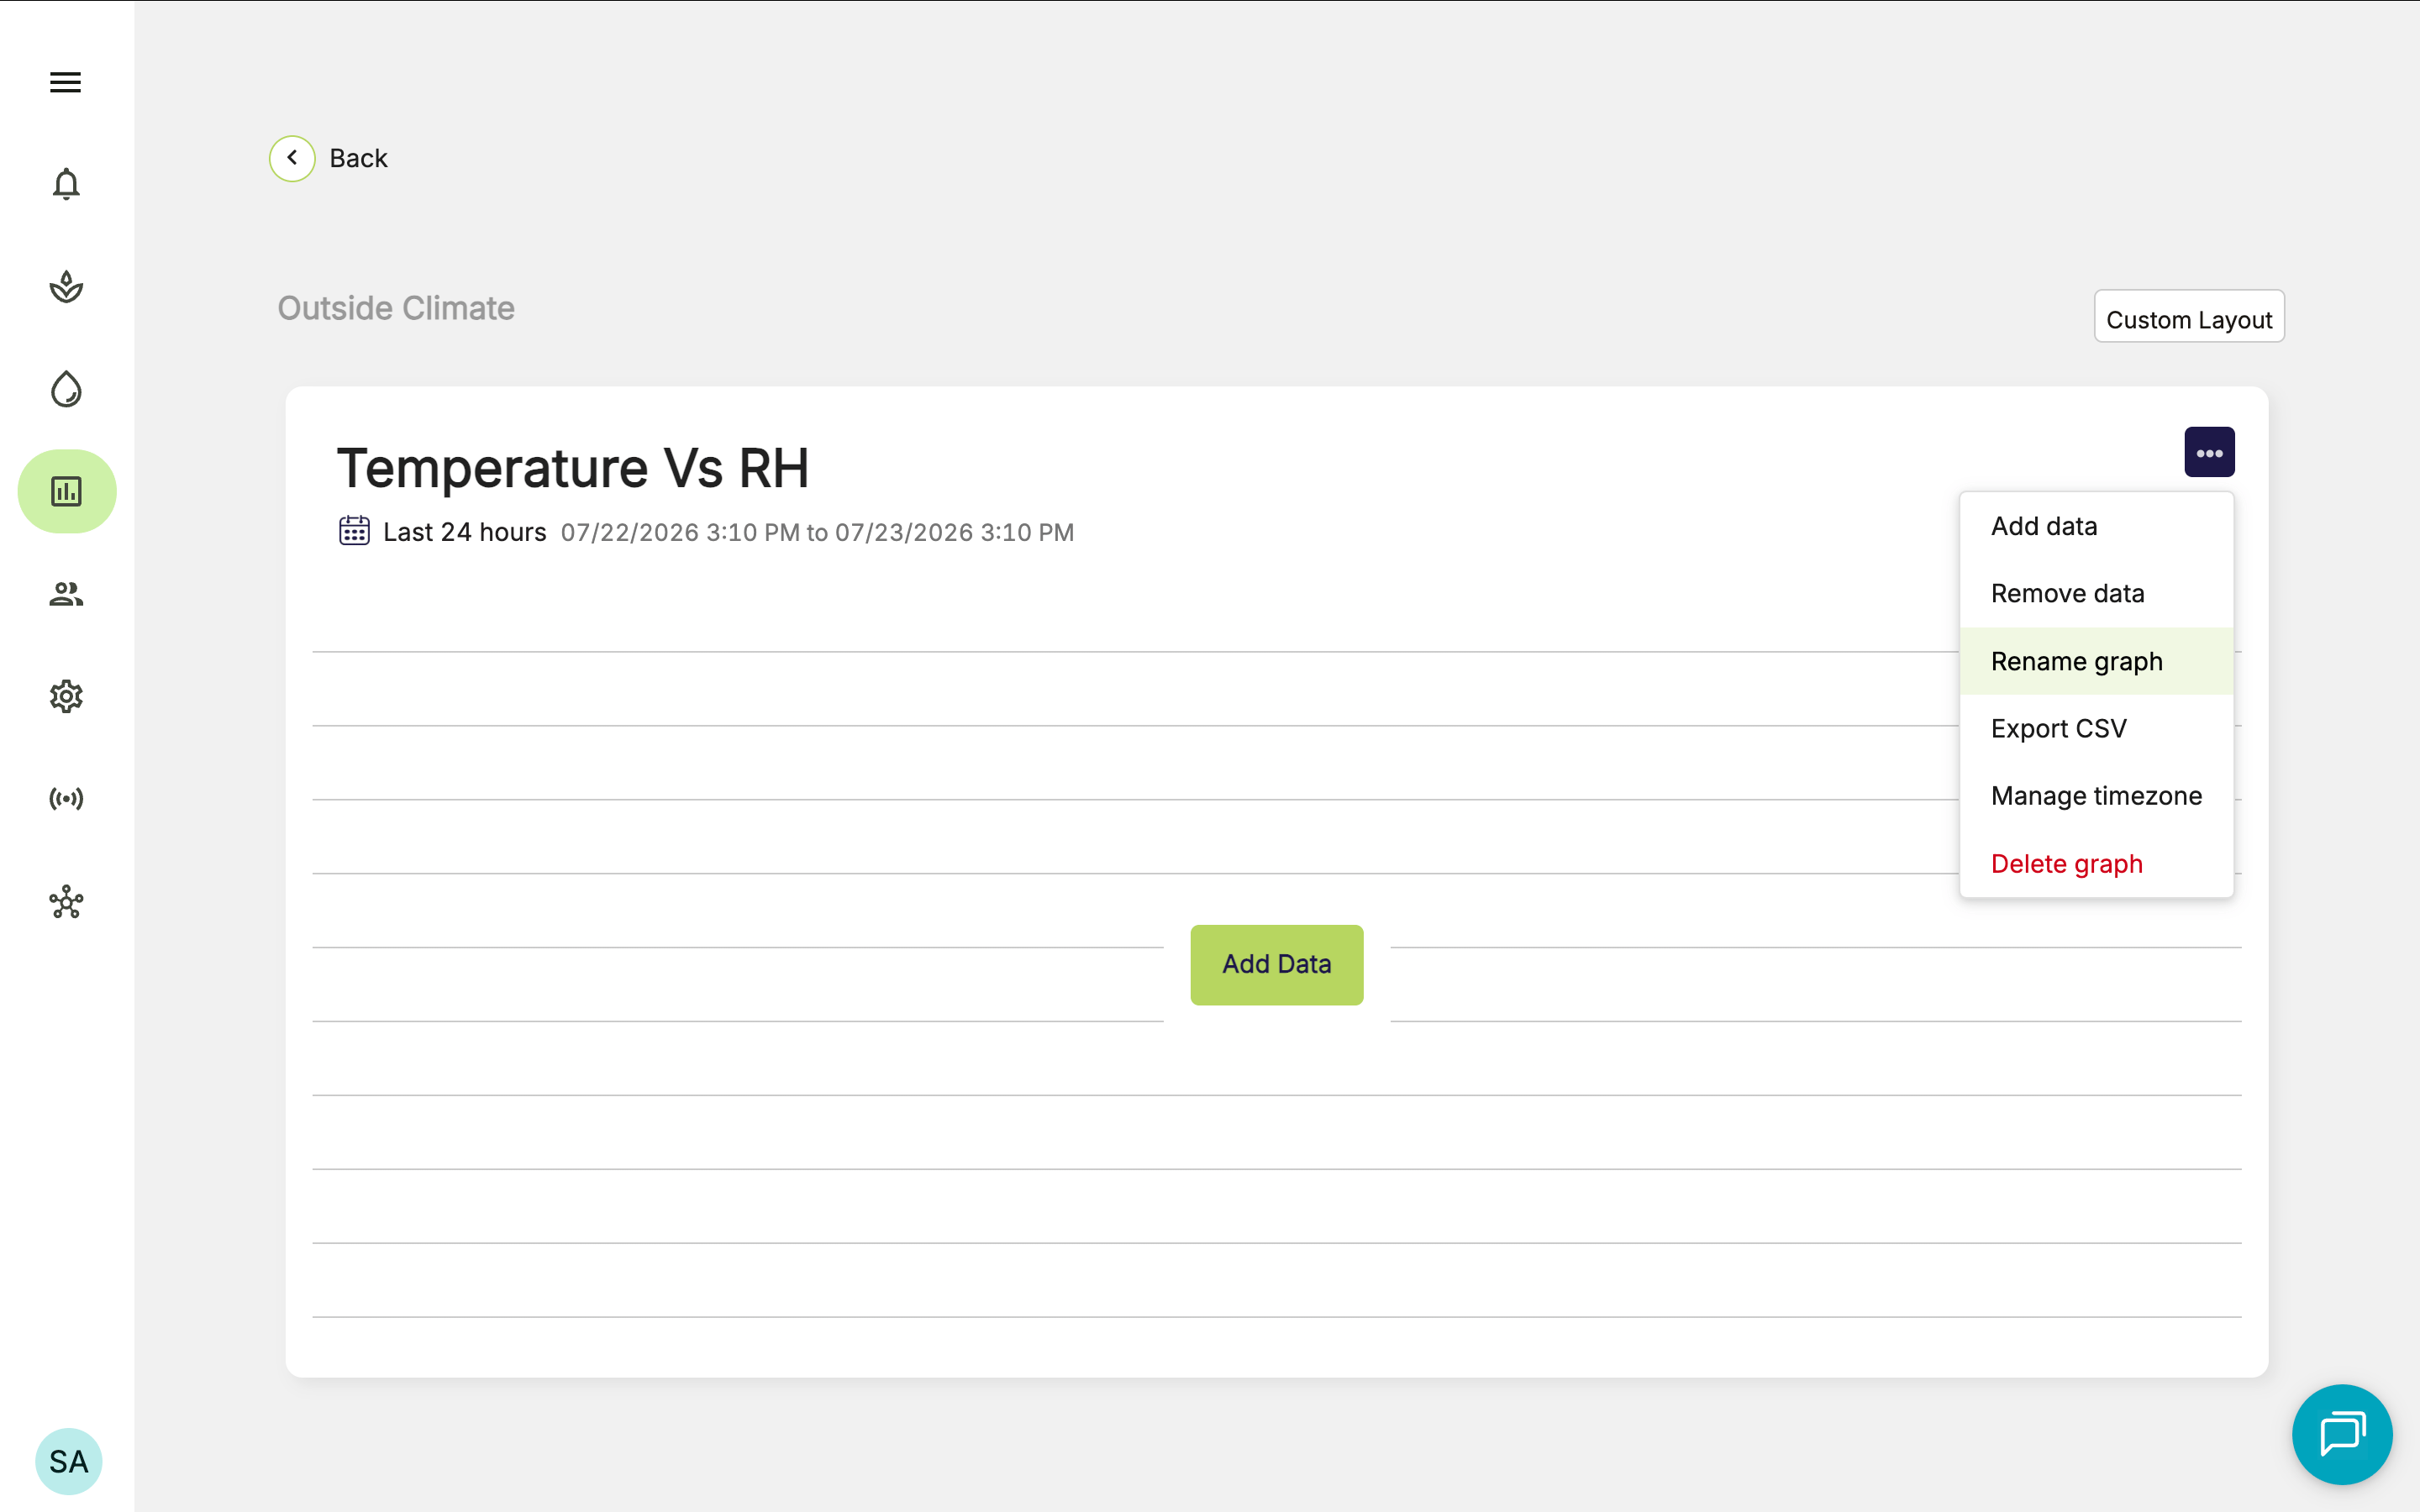
 ## Renaming a graph
1. Go to your dashboard.
2. Click on the overflow menu on the graph you want to rename.
3. Click **Rename Graph**
4. Enter a new name.
5. Click **Done**
## Renaming a graph
1. Go to your dashboard.
2. Click on the overflow menu on the graph you want to rename.
3. Click **Rename Graph**
4. Enter a new name.
5. Click **Done**
 ## Delete a graph
1. Go to your dashboard.
2. Open the overflow menu on the graph you want to delete.
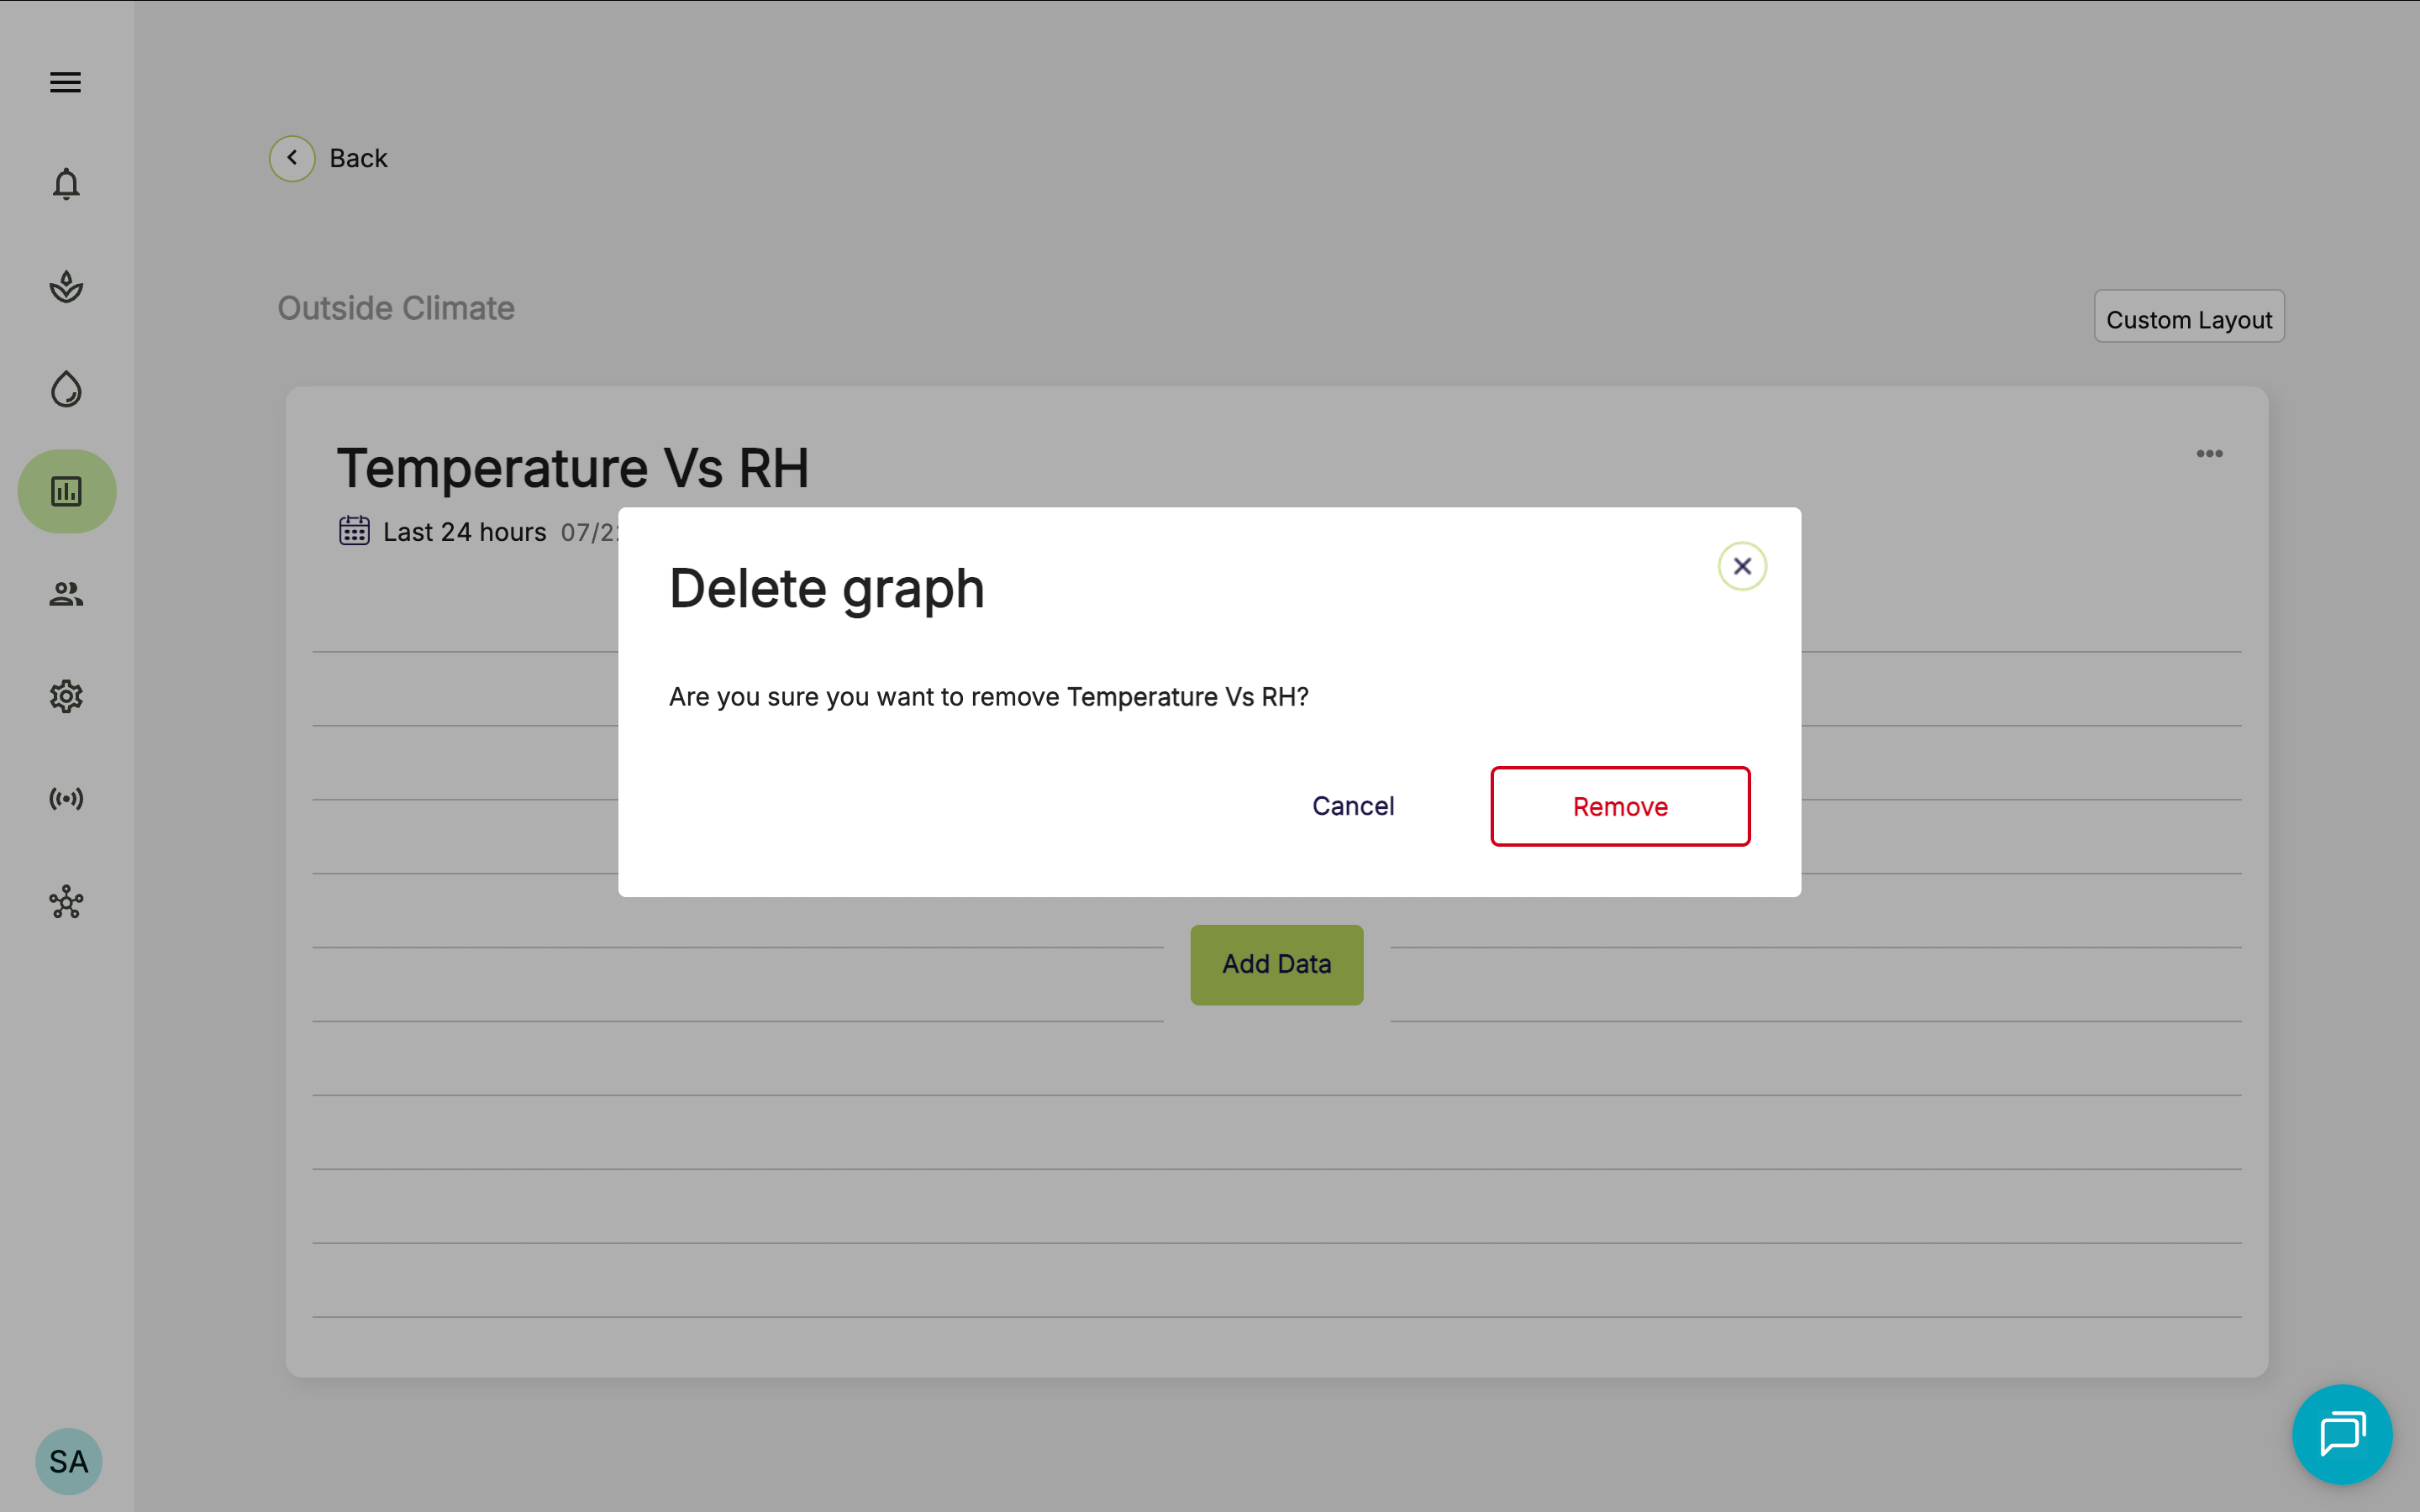
3. Click **Delete Graph**.
4. Click **Remove** to confirm.
## Delete a graph
1. Go to your dashboard.
2. Open the overflow menu on the graph you want to delete.
3. Click **Delete Graph**.
4. Click **Remove** to confirm.